Predictive maintenance with AI
From forecasting failures to planning work that improves asset availability.
A prediction creates value when someone can act on it.
AI predictive maintenance integrates sensor data, operational context, and service records to assess failure risk, identify anomalies, or predict remaining lifespan. These valuable insights are provided promptly to aid inspection, scheduling, parts management, or adjustments in operating conditions.
This guide modifies the provided deck by adding explanations for each slide. It links five practical use cases to learning approaches, a reference architecture, CMMS workflows, and a pilot evaluation strategy.
Match the question to the method
| Question | Framing | Evaluation focus |
|---|---|---|
| Will it fail soon? | Classification | Precision, recall, calibration and lead time |
| How much life remains? | RUL / survival | Error, uncertainty and censoring |
| Is behavior unusual? | Anomaly detection | Inspection yield and false alarms |
| What should the reading be? | Virtual sensor / forecasting | Error by regime and sensor health |
| Which fault is likely? | Diagnosis | Fault-class accuracy and actionable evidence |
Browse all 21 slides
01 · Predictive maintenance with AI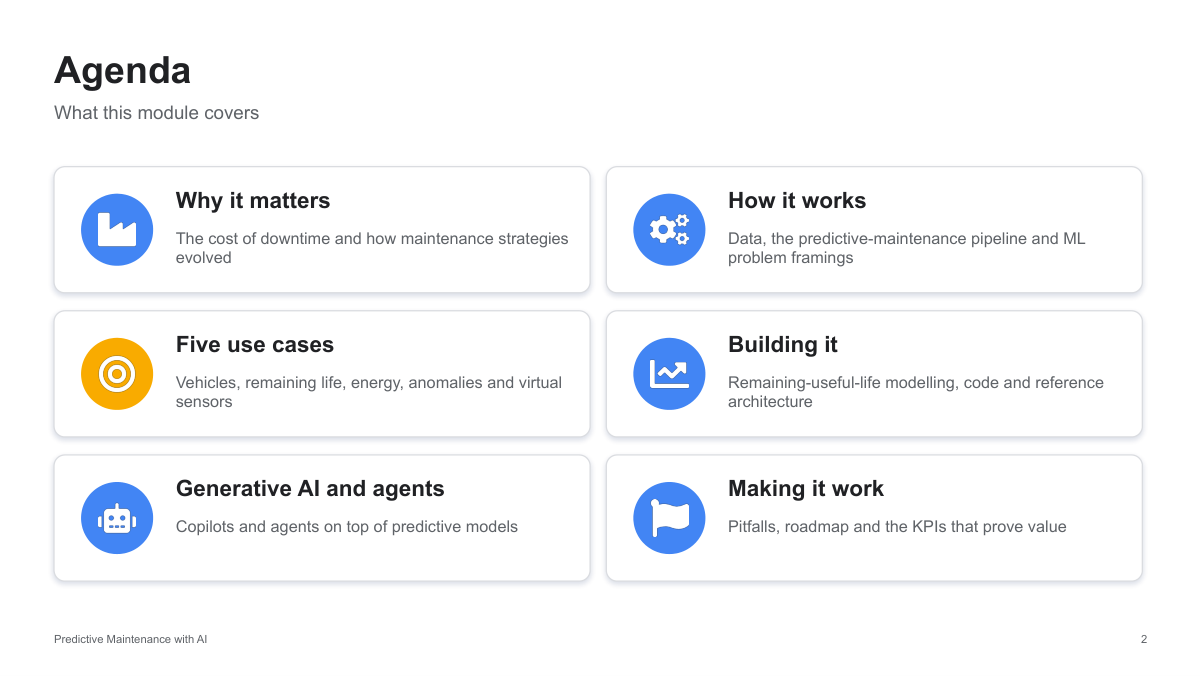 02 · From use cases to operating results
 03 · Build a local downtime business case
 04 · A portfolio of maintenance strategies
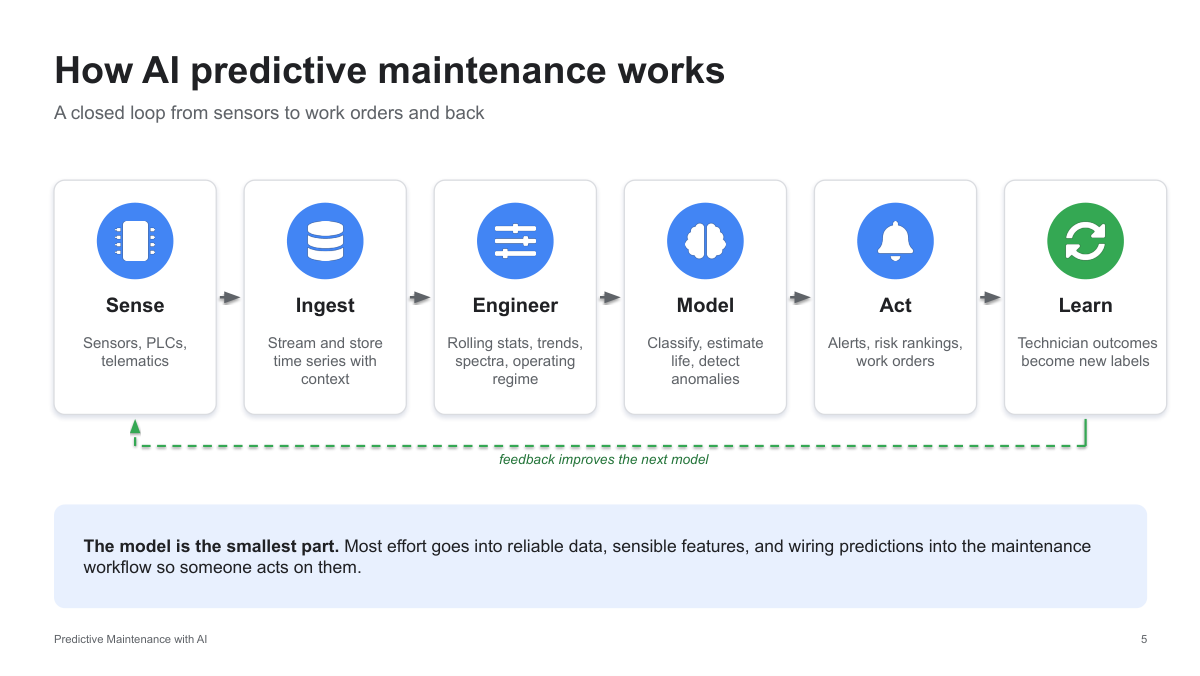 05 · Close the loop from sensing to learning
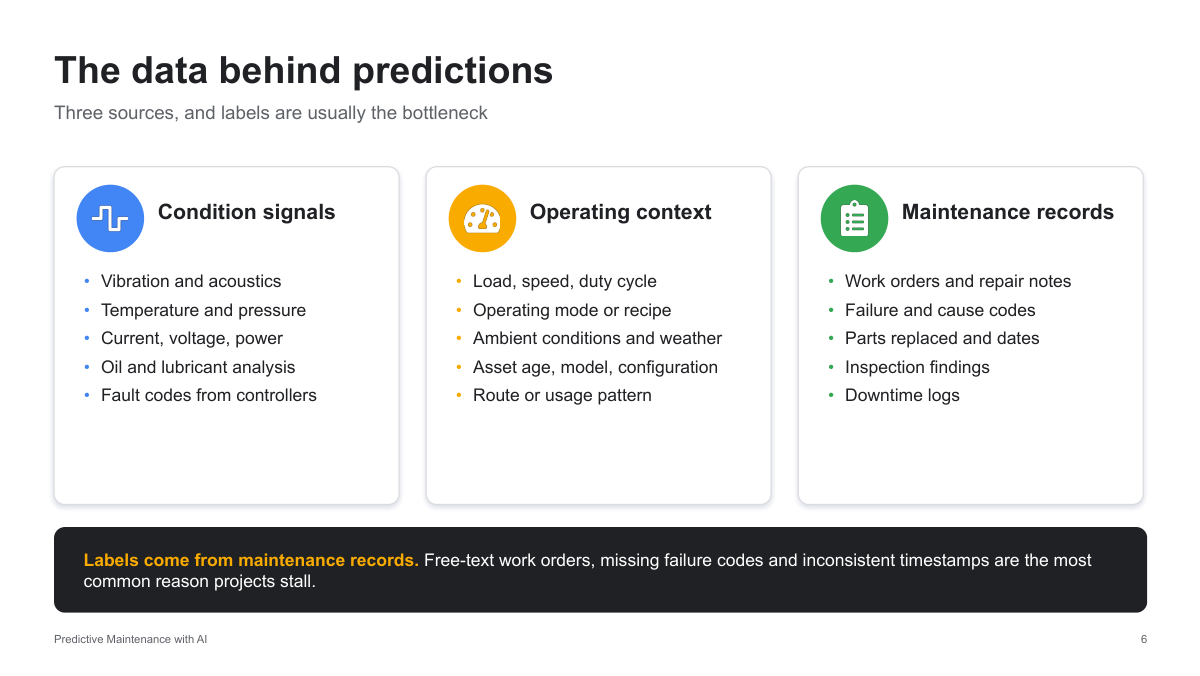 06 · Three data sources
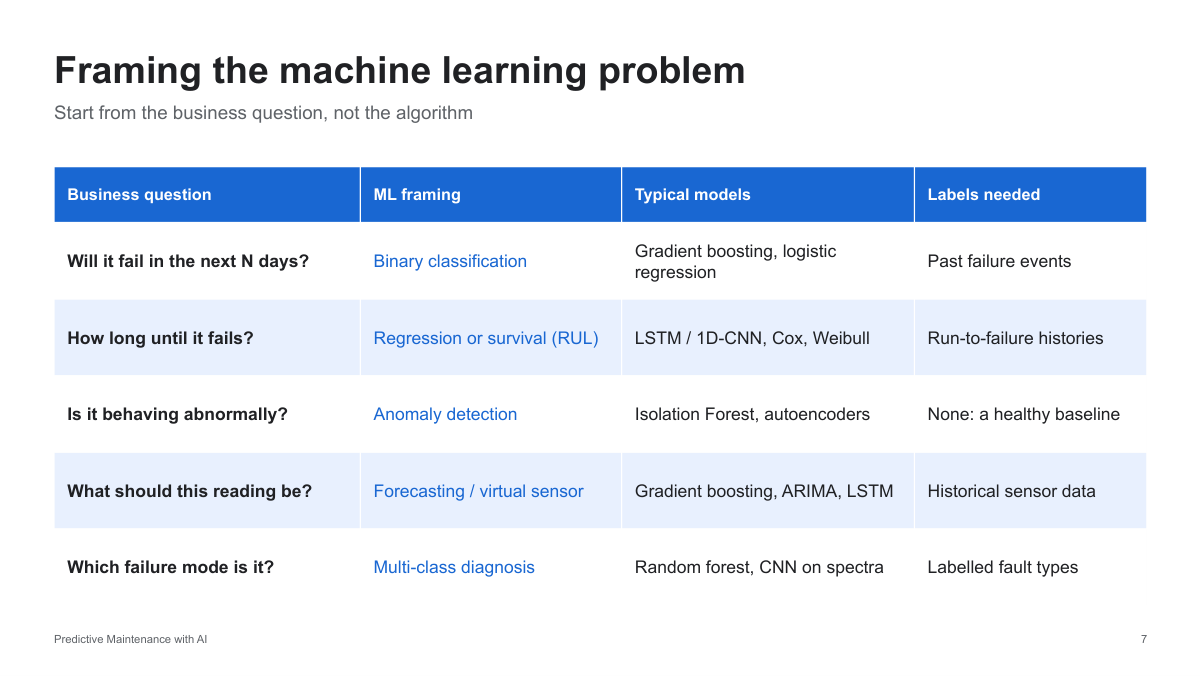 07 · Frame the business question first
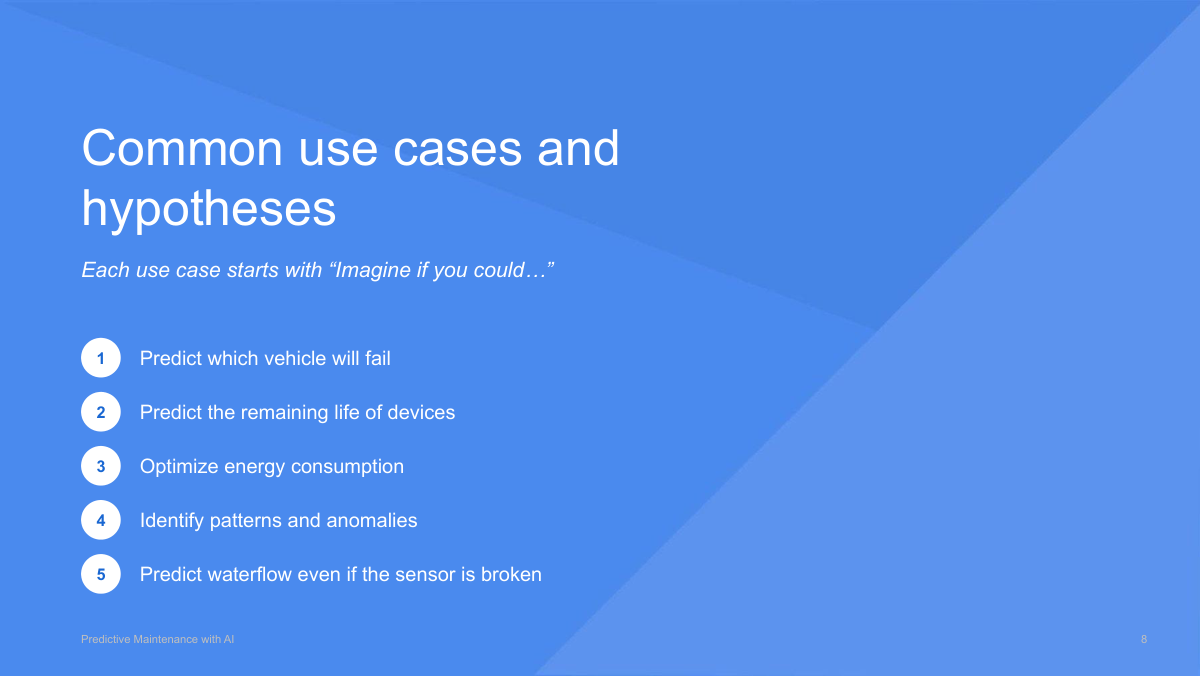 08 · Five testable hypotheses
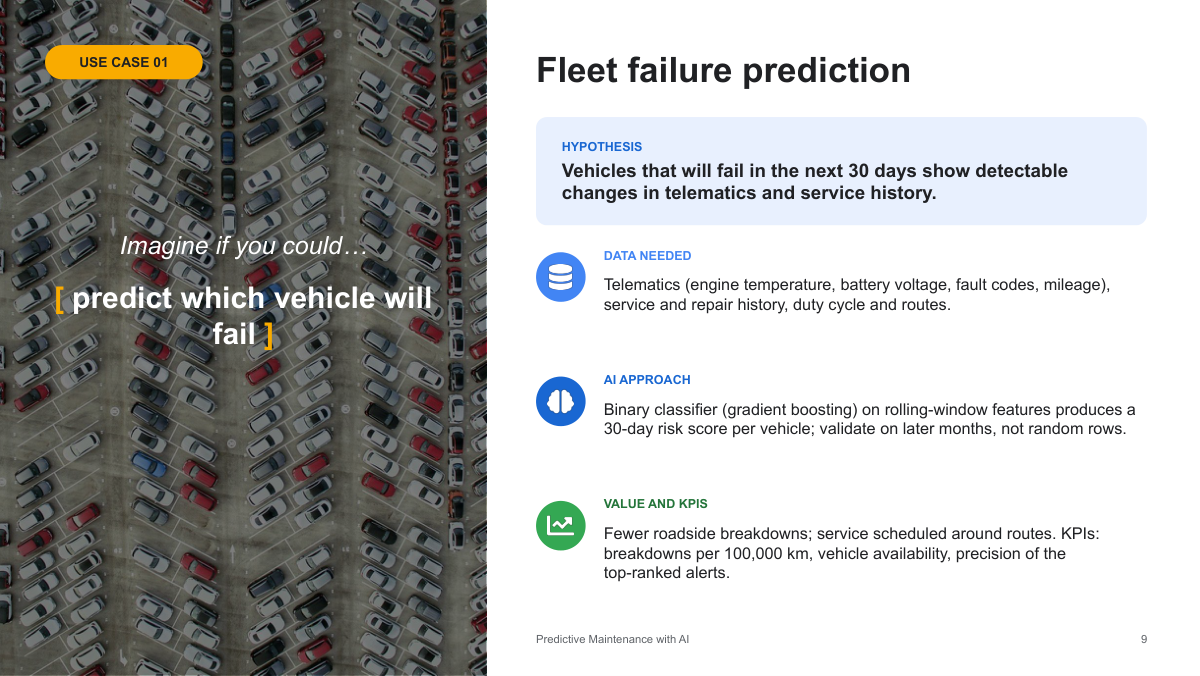 09 · Fleet failure prediction
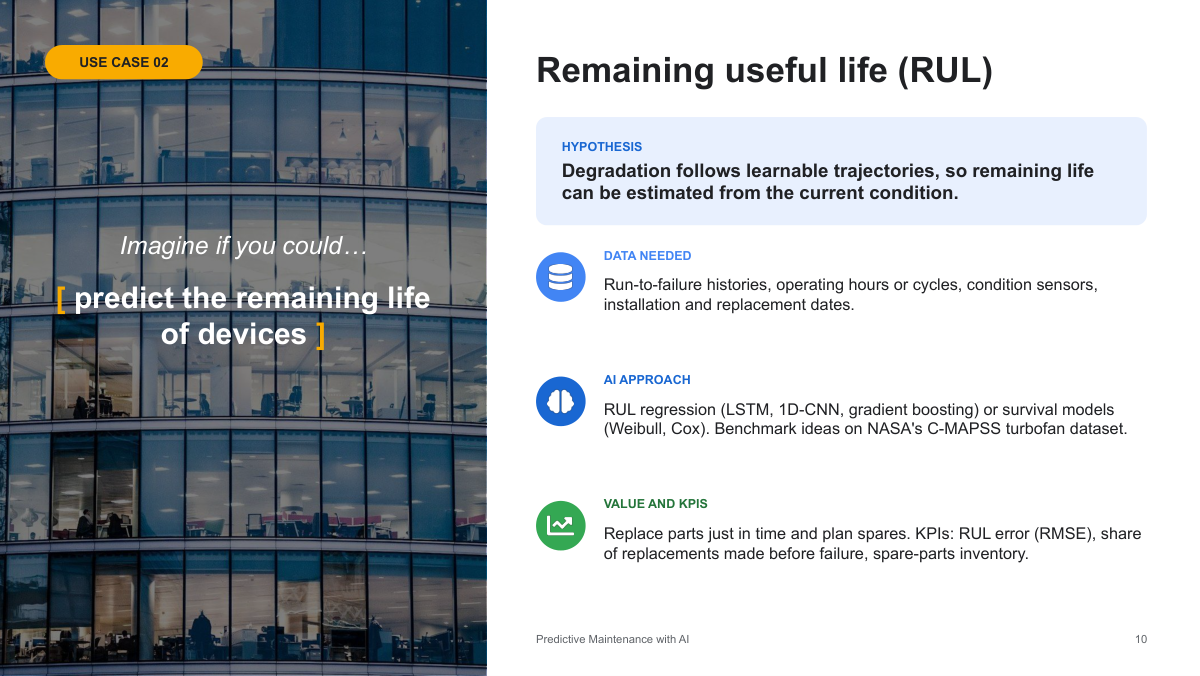 10 · Remaining useful life
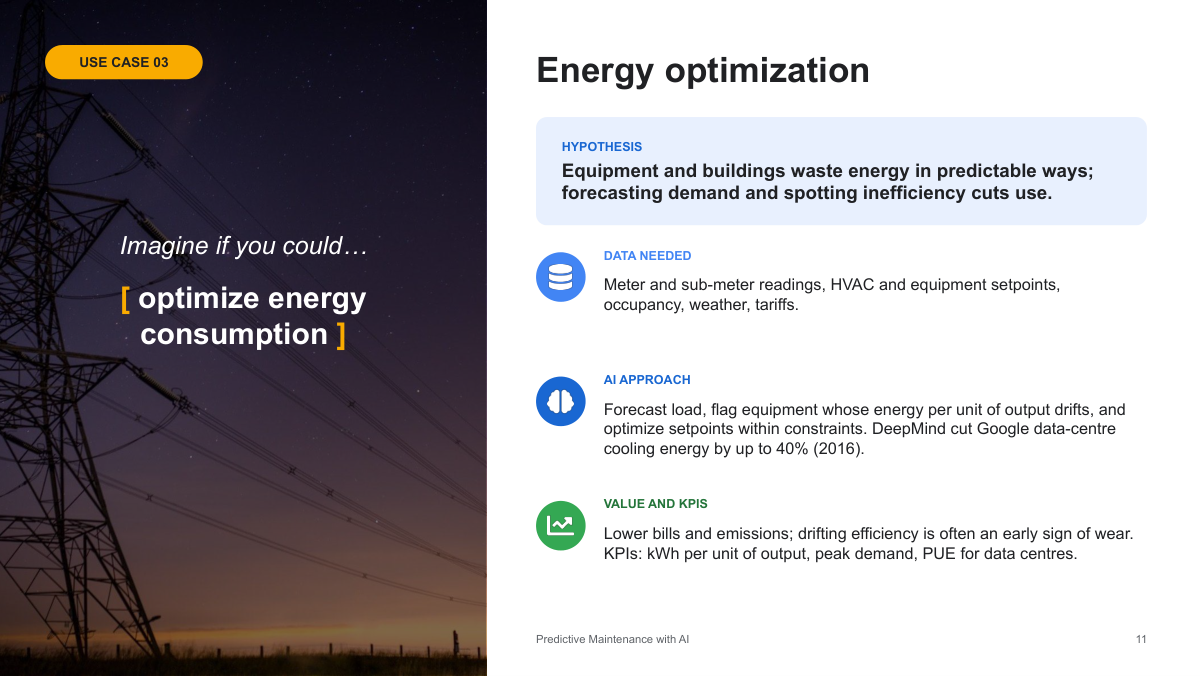 11 · Energy optimization
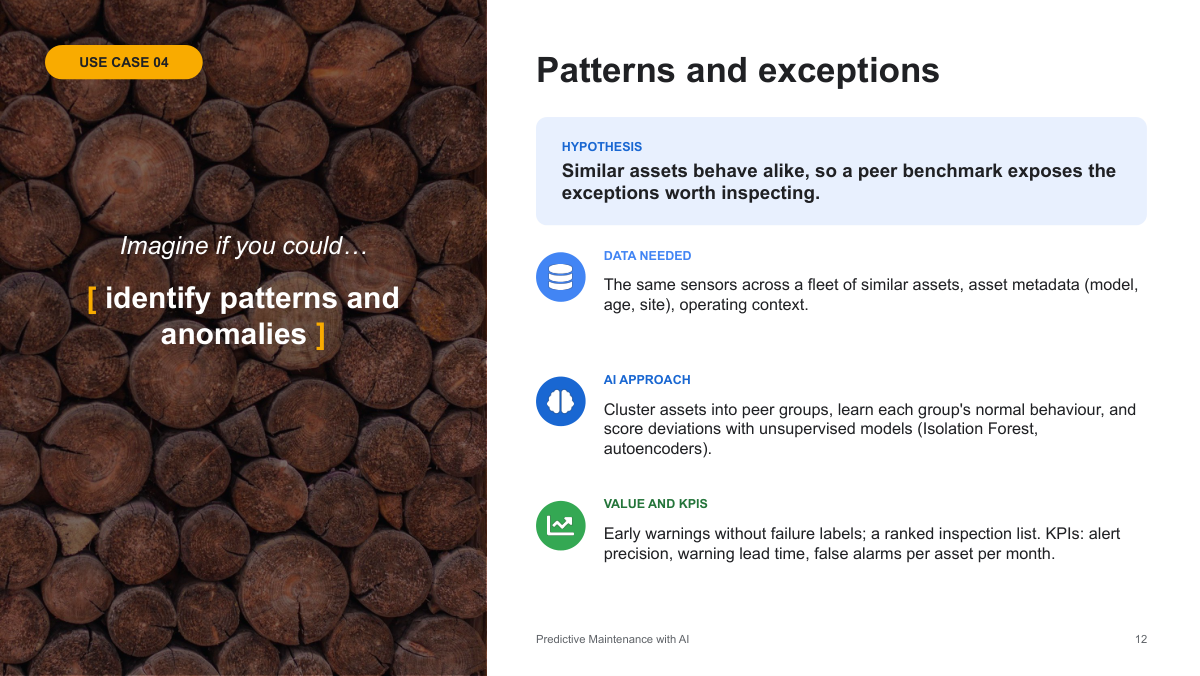 12 · Patterns and exceptions
 13 · Virtual sensors
 14 · Build defensible RUL targets
 15 · Anomaly detection with Isolation Forest
 16 · From edge signals to work orders
 17 · Generative AI and maintenance agents
 18 · Avoid data and process failure modes
 19 · Pilot one asset class before scaling
 20 · Connect model metrics to business metrics
 21 · Turn predictions into better decisions
Business value, data and learning targets
Predictive maintenance with AI
Predictive maintenance utilizes condition indicators, operational context, and maintenance records to forecast failures and prioritize tasks. The goal is to provide actionable alerts that enhance asset availability, reduce costs, or improve safety: not merely to create a more precise model.
From use cases to operating results
The deck addresses maintenance strategies, data pipelines, five use cases, remaining useful life, anomaly detection, reference architecture, generative AI, and delivery metrics. Every use case must link a testable hypothesis to data, a decision, and a quantifiable result.
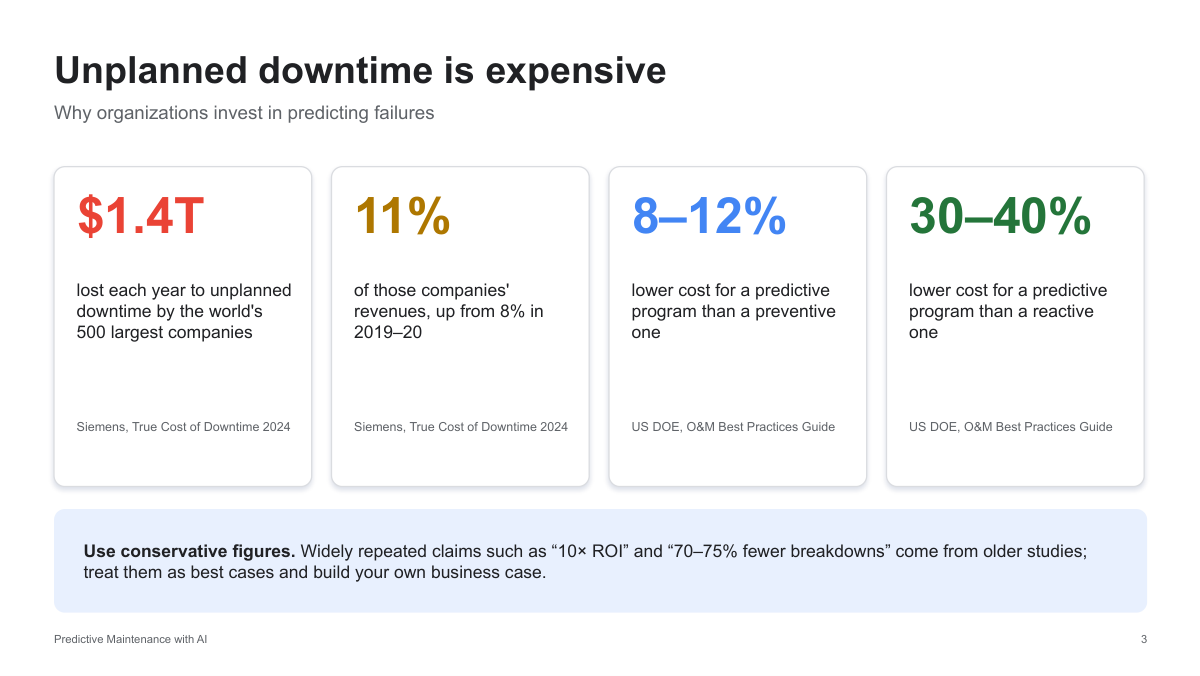
Build a local downtime business case
The slide references overall downtime estimates from Siemens and historical program-cost comparisons provided by the US Department of Energy. Consider these as context specific to their sources, rather than assured savings or up-to-date figures for your organization. Establish a baseline based on downtime, production losses, maintenance activities, and intervention costs for the assets in question.
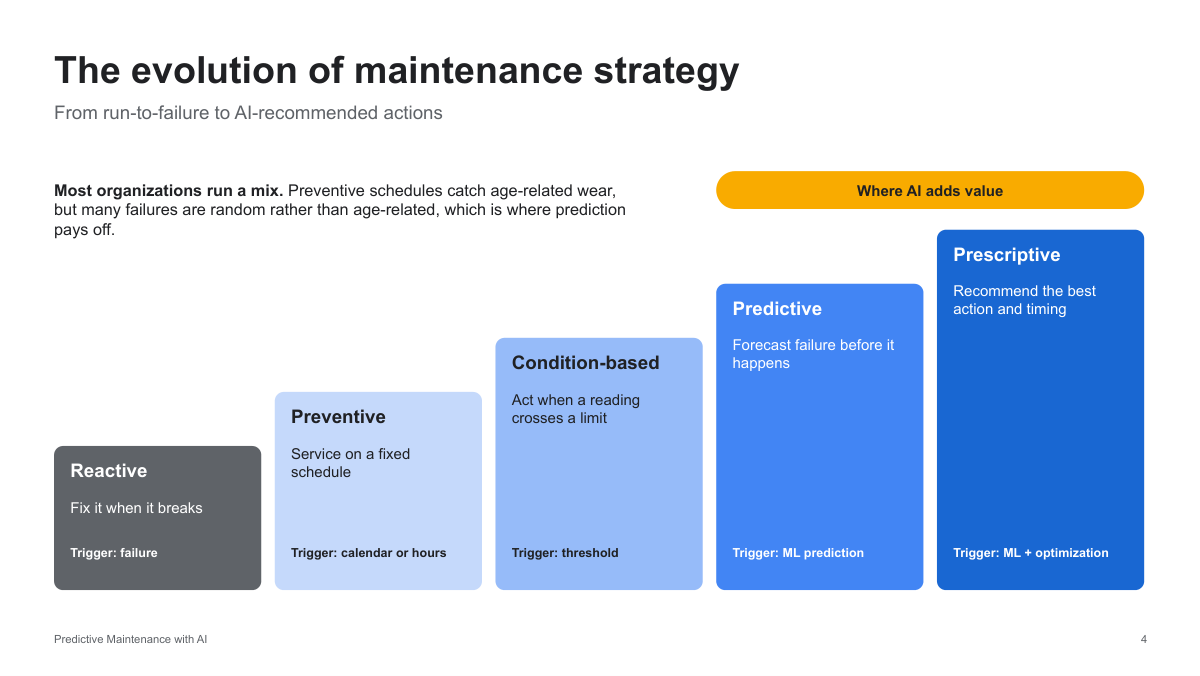
A portfolio of maintenance strategies
Reactive maintenance occurs after a failure; preventive maintenance is scheduled based on time or usage; condition-based maintenance relies on measurements; predictive maintenance depends on forecasts; prescriptive maintenance suggests specific actions. Organizations may implement all five approaches. A failure that happens randomly relative to age may not be foreseeable through sensor data.
Close the loop from sensing to learning
Detect the equipment, capture data within context, develop features, assess risk, trigger an appropriate response, and document the result. Technician observations and finalized work orders contribute to the subsequent training and assessment phase. The usefulness of predictions depends on data quality and seamless workflow integration.
Three data sources
Condition data encompasses vibration, temperature, pressure, electrical signals, lubricant analysis, and fault codes. Context covers duty, load, mode, weather, and asset configuration. Work orders, cause codes, inspections, and downtime records provide outcome labels, though their timing and interpretation need thorough validation.
Frame the business question first
Failure occurring within a time horizon indicates classification; remaining useful life points to regression or survival analysis; atypical behavior implies anomaly detection; anticipated measurements relate to forecasting or virtual sensing; fault identification corresponds to diagnosis. Survival techniques can handle censored assets, whereas direct RUL regression typically requires appropriate failure-related targets.
Five hypotheses to test
Five testable hypotheses
The use cases inquire if vehicle failures can be predicted, component lifespan assessed, energy inefficiencies identified, peer anomalies prioritized, and missing flow measurements inferred. These represent hypotheses to be tested in the target environment, not guaranteed features.
Fleet failure prediction
Utilize continuous telematics, repair records, mileage, duty cycles, and routes to predict a specified future failure risk, for example over 30 days. Validate predictions on subsequent time frames and on separate sets of vehicles. Assess breakdowns per distance traveled, availability, and the accuracy of alerts that maintenance teams are able to act upon.
Remaining useful life
Estimate the time or number of cycles until a specified failure event based on condition and usage histories. Evaluate simple baselines, regression, and survival analysis methods, while measuring uncertainty. NASA C-MAPSS, a simulated turbofan benchmark referenced in the presentation, is used; however, benchmark results alone do not guarantee performance on actual hardware.
Energy optimization
Predict energy demand and analyze consumption in relation to output, occupancy, weather, and operational settings. Identify efficiency decline prior to recommending limited adjustments. The deck’s Google cooling case is a past, location-specific example, not a universal savings promise. Monitor kWh per output, peak demand, and relevant facility indicators.
Patterns and exceptions
Organize truly comparable assets based on model, function, and operating conditions, then prioritize deviations from their anticipated performance. An abnormal measurement may signal a fault, altered operating mode, or a faulty sensor. Assess inspection yield, warning lead time, and false alarms per asset-month.
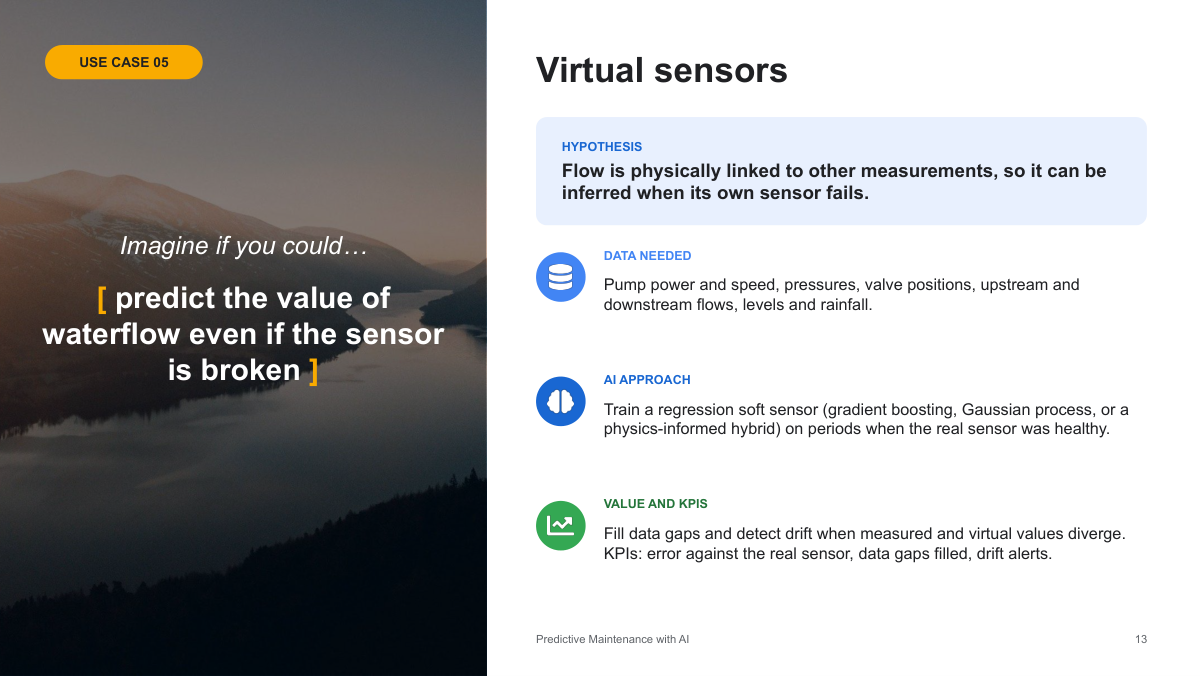
Virtual sensors
Understand how a proper flow measurement relates to pump power, speed, pressures, valves, and associated process signals. Utilize the model to estimate missing data and identify discrepancies, including uncertainty and operating boundaries. Estimated values must be clearly marked and must never quietly substitute essential safety measurements.
Models, architecture and maintenance agents
Build defensible RUL targets
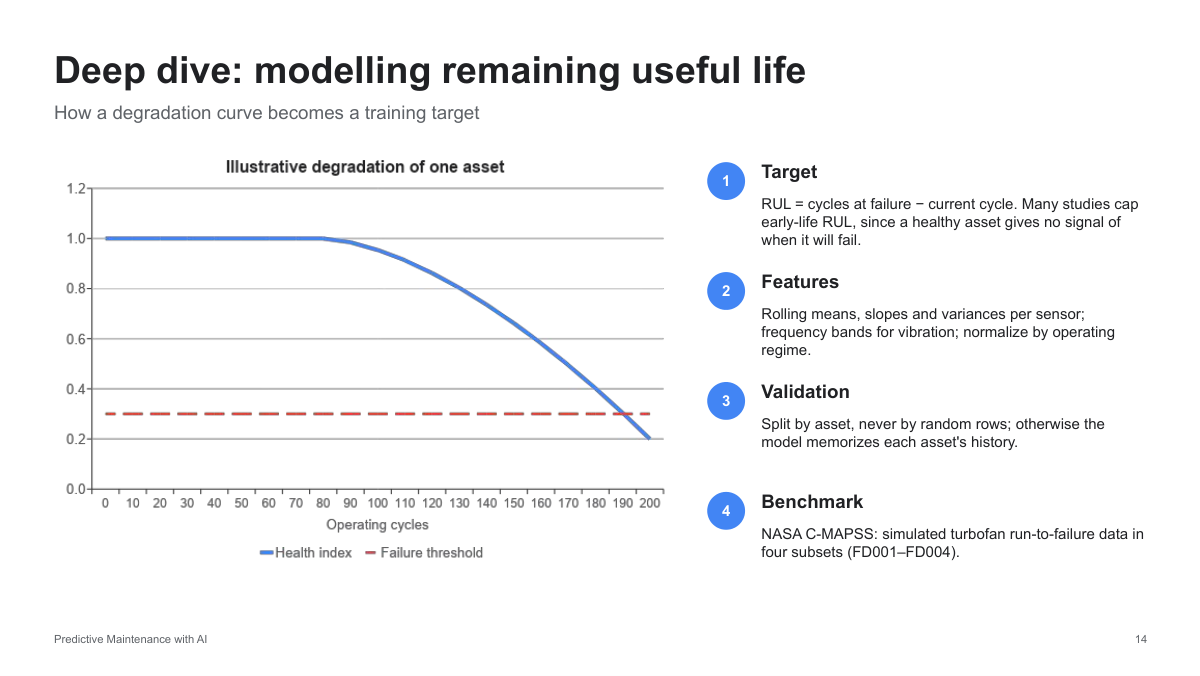
For observed run-to-failure data, RUL is calculated as the failure cycle minus the current cycle. Any target cap must be recorded. Construct rolling features using only past data, consider operating regimes, and assess performance based on deployment scenarios: unseen assets, future time frames, or both. Ensure preprocessing and tuning are performed exclusively within the training split.
Anomaly detection with Isolation Forest
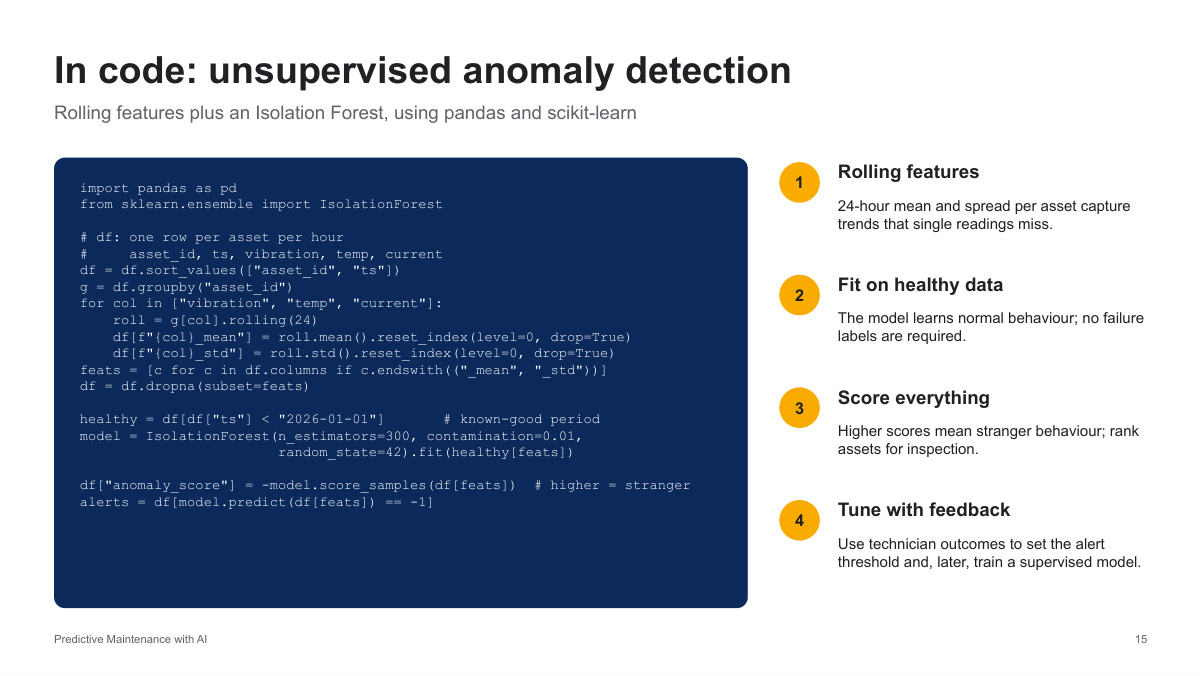
The shown code computes rolling means and standard deviations for each asset, fits an Isolation Forest during an assumed healthy timeframe, and ranks anomalous observations. A 24-row window corresponds to 24 hours, assuming consistent hourly sampling. The date cutoff does not guarantee health, and contamination = 0.01 is a parameter for setting the threshold, not an actual fault probability. This code serves as an example and has not been executed on the provided data.
From edge signals to work orders
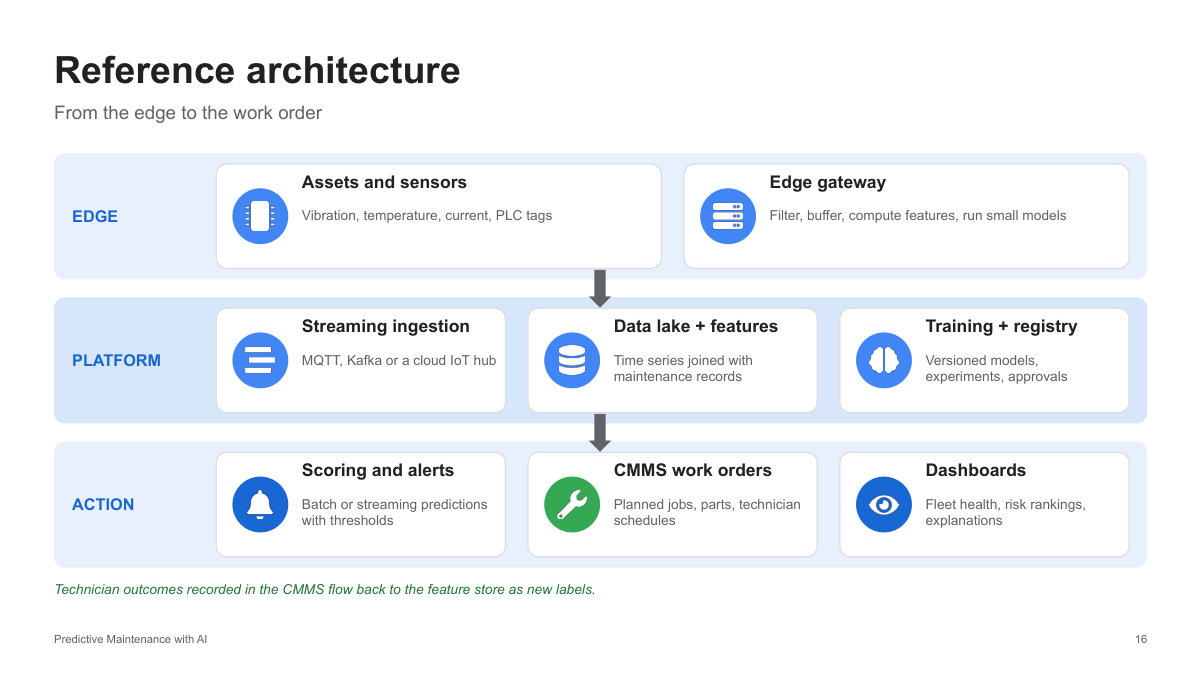
Edge gateways filter and buffer signals from assets. A platform integrates streaming data with maintenance records, handles features, and manages model versions. Scoring generates ranked alerts that link to CMMS work orders and dashboards. Technician outcomes are returned as labels, maintaining consistent asset identifiers and timestamps throughout.
Generative AI and maintenance agents
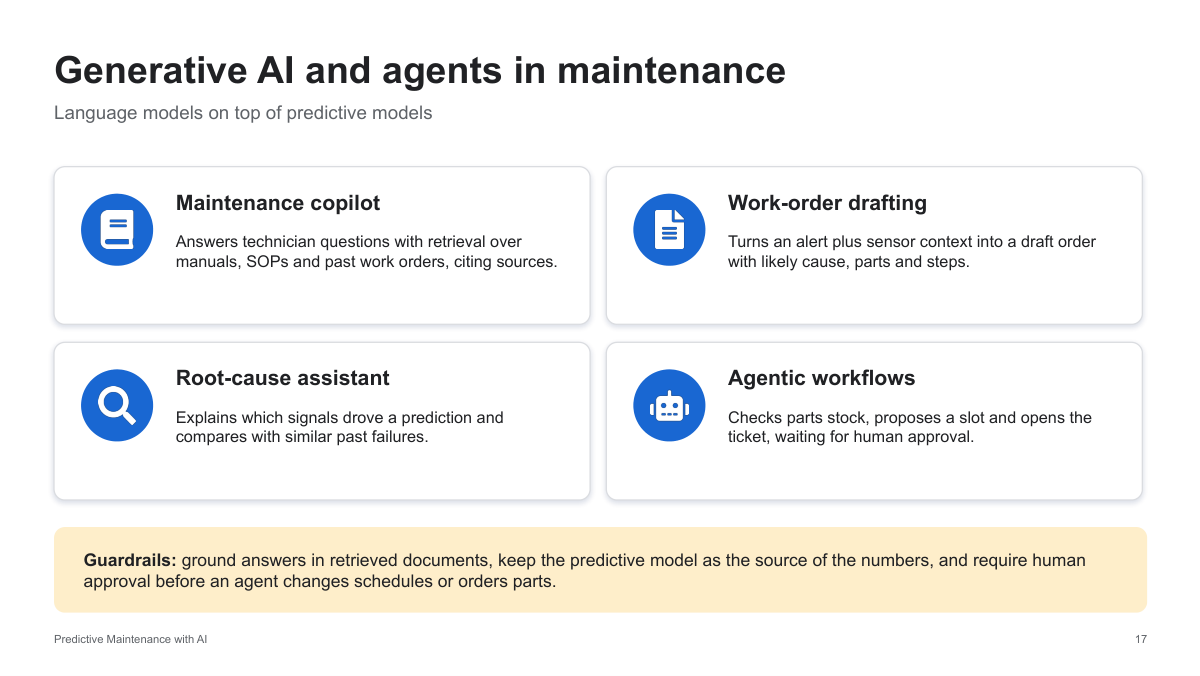
A grounded copilot can access manuals and procedures, create work orders, and summarize pertinent evidence. Quantitative estimates still rely on predictive models. Feature contributions and comparable cases may offer hypotheses but do not determine the root cause. Ensure authorized review before agents modify schedules or request parts.
Avoid pitfalls and prove operating value
Avoid data and process failure modes
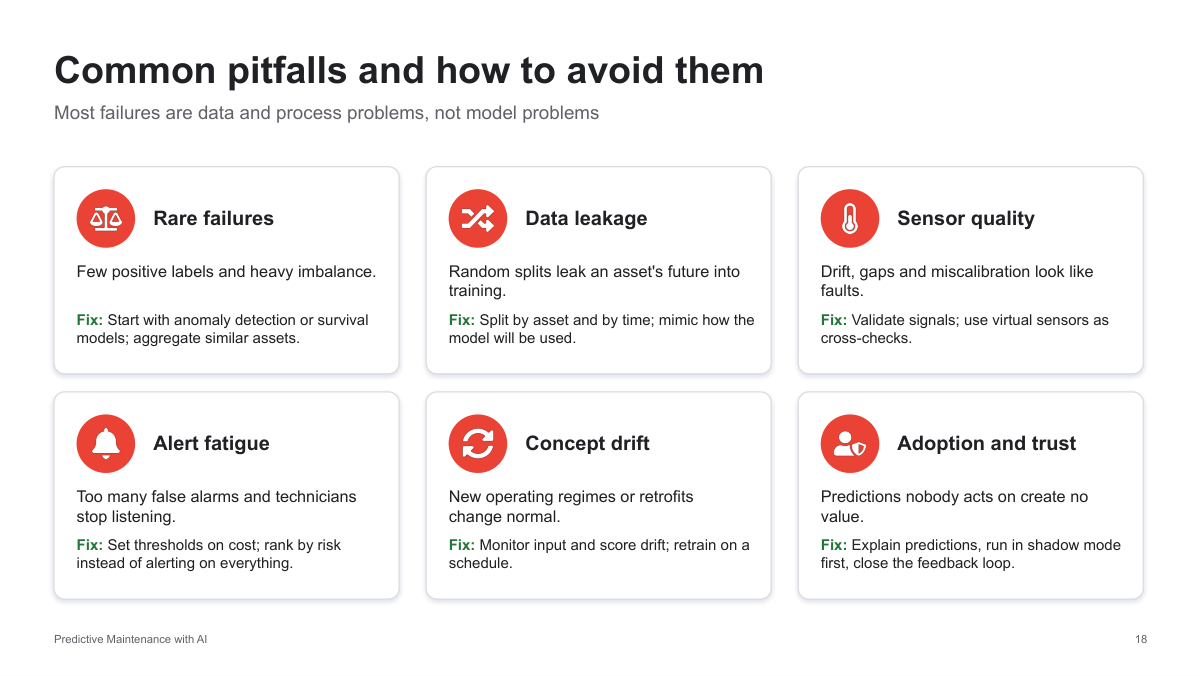
Infrequent occurrences, data leakage, sensor drift, too many alerts, shifting operating conditions, and low adoption can all compromise an otherwise robust model. Verify signals and labels, employ deployment-relevant data splits, benchmark against basic rules, adjust thresholds based on costs and capacity, and track performance prior to deciding on retraining.
Pilot one asset class before scaling
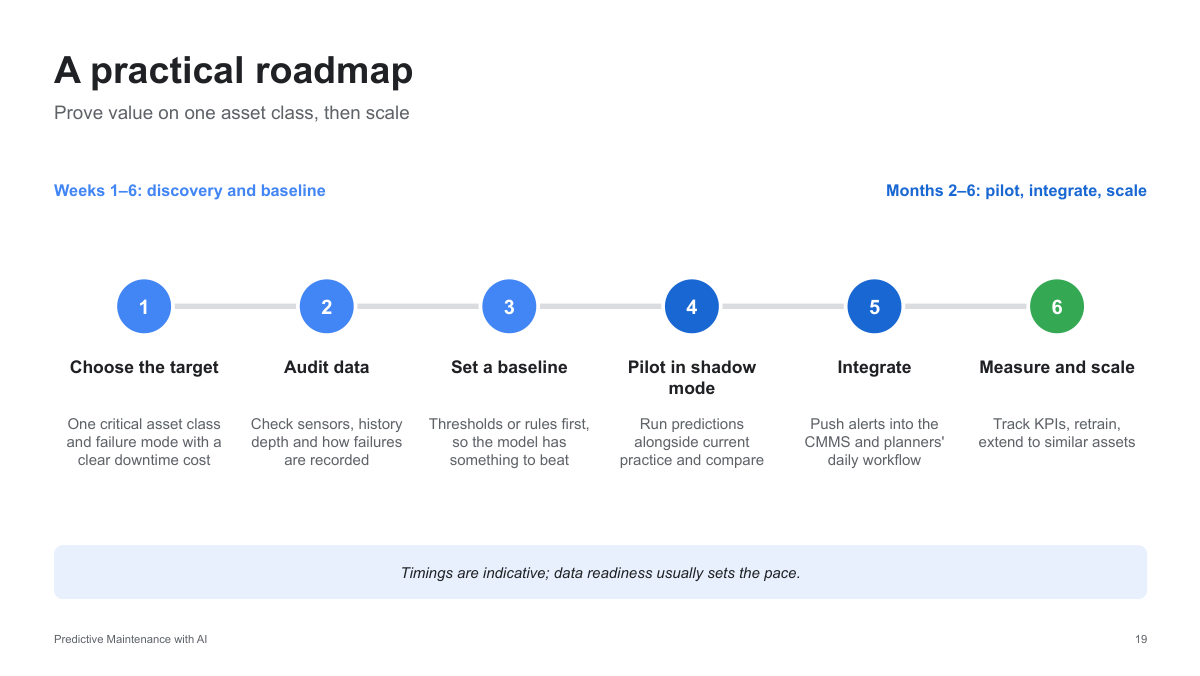
Select a critical asset and its failure mode, audit the data, set a baseline, operate in shadow mode, integrate with planners and the CMMS, then assess value. The deck’s timeline of weeks to months is approximate; actual speed depends on data availability, failure rates, and operational validation.
Connect model metrics to business metrics
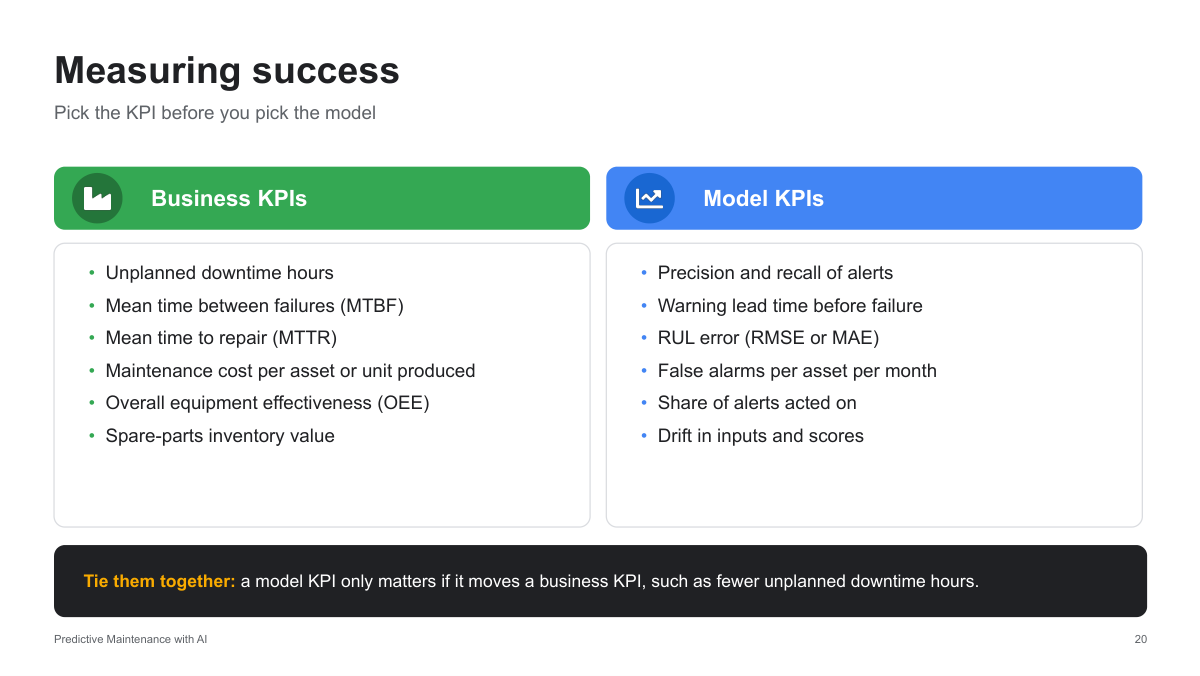
Monitor downtime, repair duration, maintenance expenses, OEE, and inventory together with precision, recall, warning lead time, RUL error, false-alarm rate, and action rate. Evaluate if the noted improvements remain consistent after considering operating conditions and modifications in maintenance procedures.
Turn predictions into better decisions
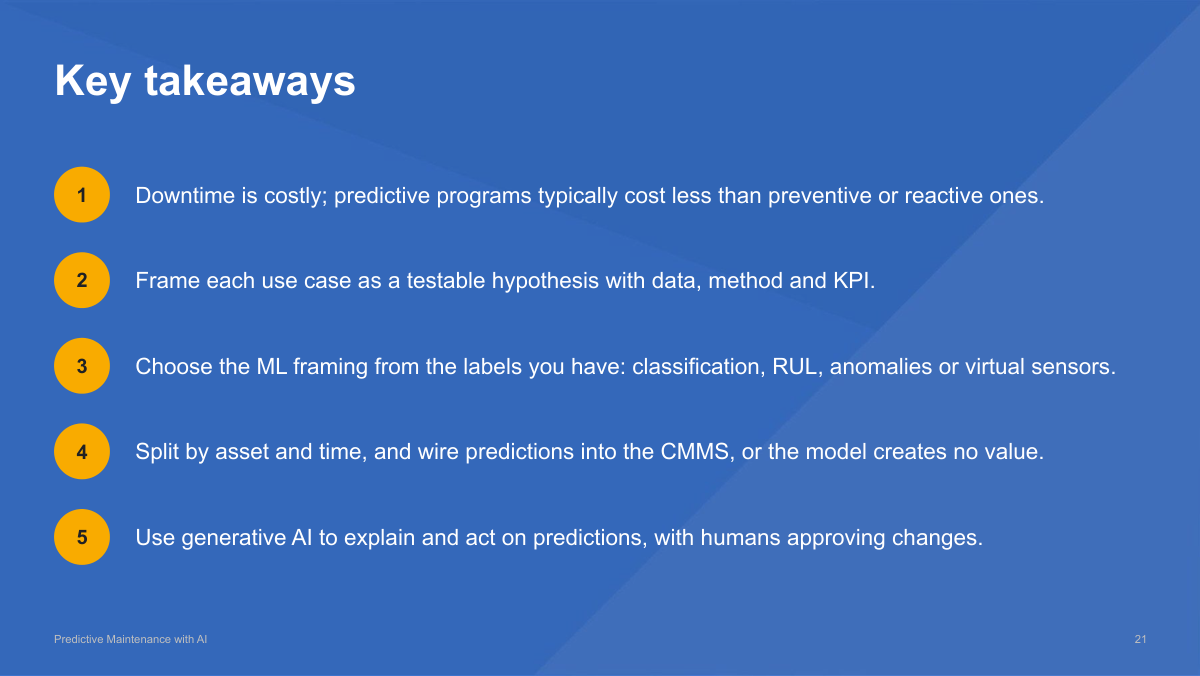
Select a clear failure hypothesis, apply the appropriate learning objective, validate according to asset and timing as needed, and link results to accountable actions. Show value relative to a baseline. Employ generative AI for informed explanation and support, while maintaining control over critical maintenance decisions.
Predictive maintenance FAQ
What is AI predictive maintenance?
Predictive maintenance utilizes condition indicators, operational context, and maintenance records to forecast failures and prioritize tasks. The goal is to provide actionable alerts that enhance asset availability, reduce costs, or improve safety: not merely to create a more precise model.
How does it differ from preventive maintenance?
Preventive maintenance adheres to a set schedule or usage interval. Predictive maintenance relies on projected future conditions or risks to determine timing. The appropriate method depends on failure mechanisms, available evidence, and potential consequences.
Can a pilot start without failure labels?
Anomaly detection may begin with a thoroughly validated baseline, yet atypical behavior does not necessarily indicate a fault. Technician input is required to confirm alerts and create outcome labels.
What is remaining useful life?
RUL refers to the remaining duration or usage before reaching a specified failure point. Its estimation relies on the present condition, anticipated future operating conditions, and the training dataset, making uncertainty significant.
Why split by asset and time?
Random row selections may reveal linked asset history or future details during evaluation. Opt for splits that mimic the deployment scenario and apply preprocessing exclusively to the training data.
Where do generative AI agents fit?
A grounded copilot can access manuals and procedures, create work orders, and summarize pertinent evidence. Quantitative estimates still rely on predictive models. Feature contributions and comparable cases may offer hypotheses but do not determine the root cause. Ensure authorized review before agents modify schedules or request parts.
About this guide
Source: the supplied 21-slide “Predictive Maintenance with AI” presentation. The deck cites Siemens’ True Cost of Downtime 2024, the US DOE O&M Best Practices Guide, NASA C-MAPSS and Google’s historical cooling-efficiency example. These examples are source-specific context, not promised outcomes for a new deployment.
The code shown in the original slide image is provided for learning purposes; no external dataset was utilized to run it. Clarifications are given on evaluation, target creation, anomaly thresholds, and the difference between explanations and confirmed root causes.