01. Core User Satisfaction Metrics
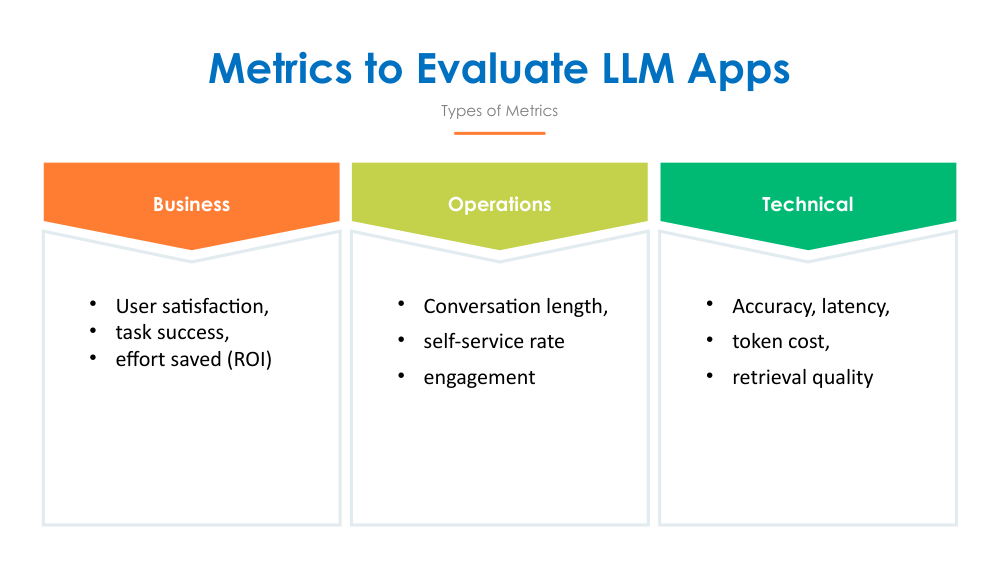
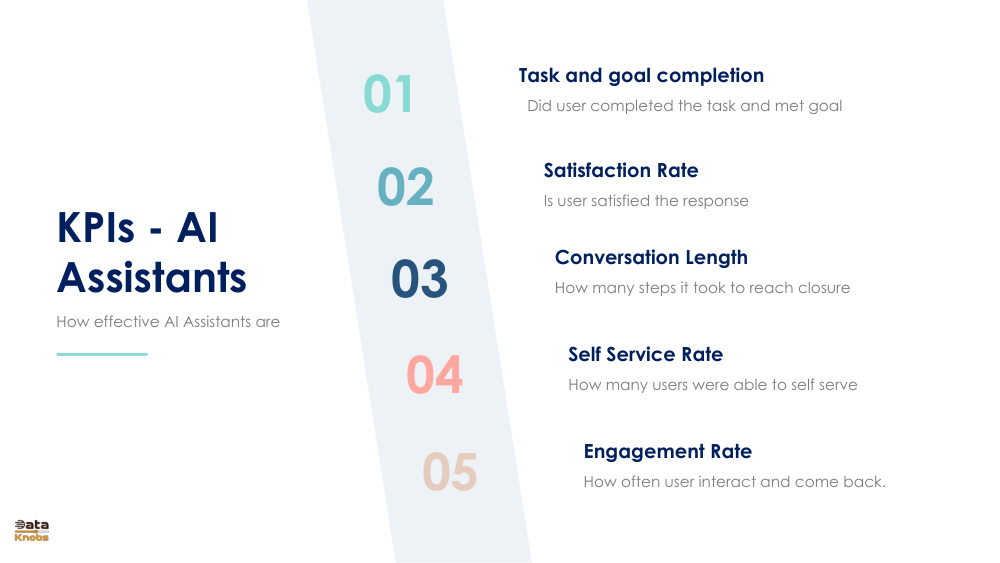
The foundation of AI assistant evaluation lies in understanding user satisfaction and engagement. These five core metrics measure how well your AI assistant is performing from the user's perspective.
01Task and Goal Completion
Measures whether the user successfully completed their intended task and met their stated goals. This is the ultimate measure of assistant effectiveness.
02Satisfaction Rate
Evaluates whether the user is satisfied with the response provided. Typically measured through ratings or surveys after each interaction.
03Conversation Length
Tracks how many steps or turns it took to reach closure. Fewer steps generally indicate better efficiency and a more intuitive assistant.
04Self Service Rate
Measures the percentage of users able to self-serve without human intervention. Higher rates indicate better automation and reduced support costs.
05Engagement Rate
Tracks how often users interact with the assistant and return for additional help. Indicates user trust and perceived value of the system.
Understanding Each Metric
Task and Goal Completion Rate
Definition: The percentage of conversations where the user's primary objective was achieved.
Why it matters: This is the most critical metric. A high completion rate indicates your assistant is genuinely helpful and solves real user problems.
Target: Aim for 80-95% completion rate, depending on task complexity.
Satisfaction Rate
Definition: Percentage of users rating the assistant response positively (typically 4-5 stars out of 5).
Why it matters: Reflects user sentiment and perception of the assistant's quality and helpfulness.
Target: Aim for 75-85% positive satisfaction ratings.
Conversation Length
Definition: Average number of turns/exchanges needed to resolve a user issue.
Why it matters: Shorter conversations suggest the assistant understands user needs quickly and provides direct solutions.
Target: 2-5 turns for optimal efficiency, depending on problem complexity.
Self Service Rate
Definition: Percentage of interactions resolved without escalation to human support.
Why it matters: Directly impacts operational costs and customer satisfaction; reduces support team burden.
Target: Aim for 70-90% self-service, with escalation for complex issues.
Engagement Rate
Definition: Percentage of users who return to use the assistant after their first interaction.
Why it matters: Indicates long-term value and user trust in the system. Returning users are more satisfied.
Target: Aim for 40-60% return user rate, indicating consistent value delivery.
02. Response Quality Metrics
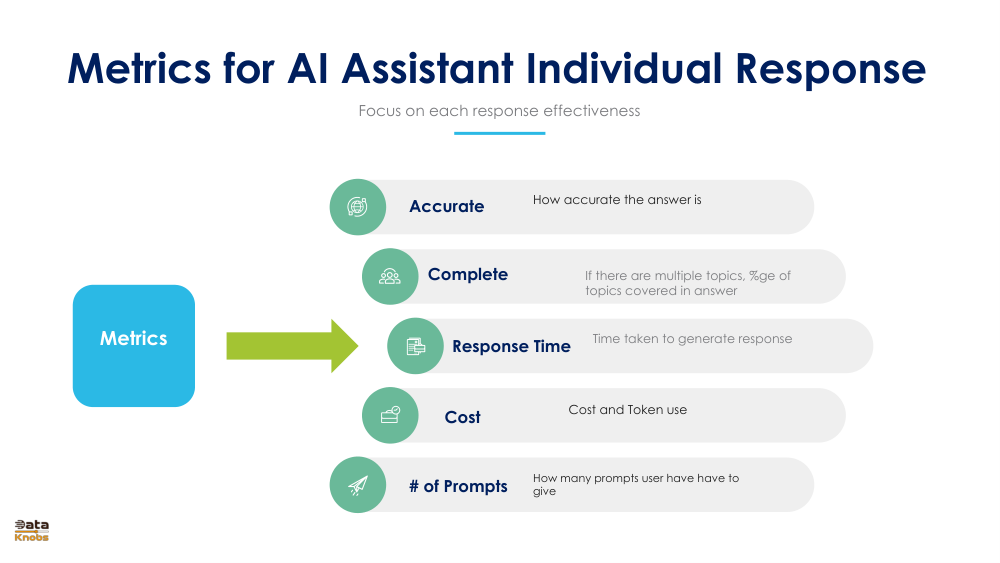
While user satisfaction metrics capture the overall experience, response quality metrics focus on the effectiveness of individual responses. These metrics directly measure how well each response performs.
Five Key Response Quality Measures
Response Time
Time taken to generate and deliver a response. Users expect quick answers — typically under 2-3 seconds for optimal experience.
Cost
Operational cost per response including token usage and infrastructure. Important for profitability and scalability of the system.
Accuracy
How accurate and factually correct the answer is. This is critical for building user trust and avoiding misinformation.
Completeness
If multiple topics exist in the user query, what percentage of topics were addressed in the answer. Higher coverage = better response.
Number of Prompts
How many prompts users must give to get a satisfactory answer. Fewer prompts needed indicates better initial understanding and responsiveness.
Quality Metrics Summary
| Metric | Measurement | Target |
|---|---|---|
| Response Time | Seconds to deliver | < 3 seconds |
| Accuracy | % correct answers | 90%+ |
| Completeness | % topics covered | 85%+ |
| Cost per Response | Tokens used | Depends on model |
| # of Prompts | Iterations needed | 1-2 prompts |
03. Technical Metrics to Evaluate LLM
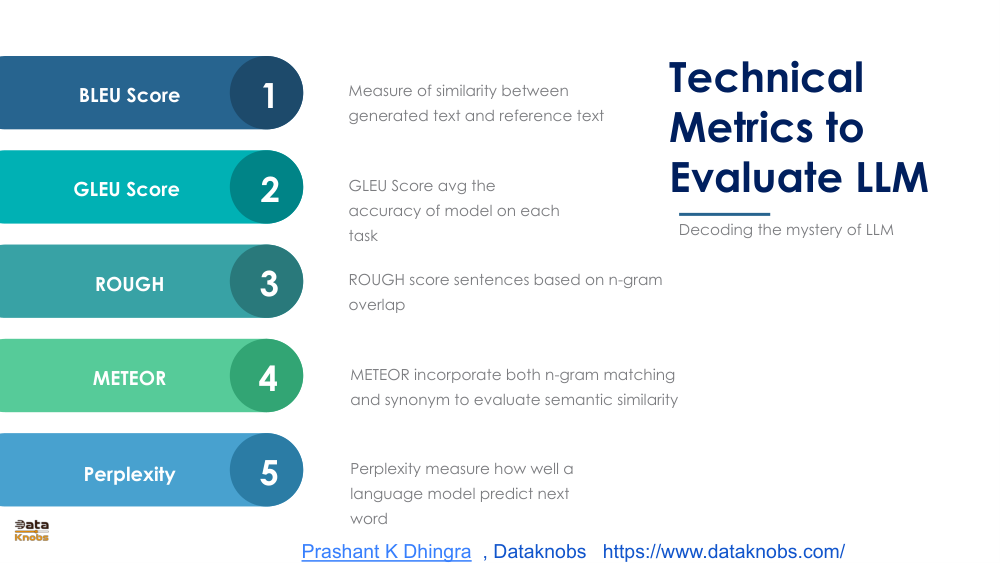
Behind every AI assistant are sophisticated language models. These technical metrics measure the quality and performance of the underlying LLM at a mathematical and computational level. Understanding these helps optimize model selection and fine-tuning.
Five Essential Technical Metrics
- BLEU Score (Bilingual Evaluation Understudy) Measures the similarity between generated text and reference text using n-gram overlap. Ranges from 0-1, where 1 is perfect match. Useful for comparing output against gold-standard answers.
- GLEU Score (Google BLEU) Averages the accuracy of the model on each specific task. More lenient than BLEU, accounts for partial matches and task-specific variations. Better reflects real-world assistant performance.
- ROUGE (Recall-Oriented Understudy for Gisting Evaluation) Scores responses based on n-gram overlap with reference texts. Particularly useful for evaluating summarization and text generation tasks. Focuses on recall rather than precision.
- METEOR (Metric for Evaluation of Translation with Explicit ORdering) Incorporates both n-gram matching and synonym matching to evaluate semantic similarity. Goes beyond surface-level word matching to understand meaning. Generally better than BLEU for human perception.
- Perplexity Measures how well a language model predicts the next word. Lower perplexity indicates better performance. Indicates model confidence and quality — lower values (typically 20-100) show better prediction ability.
When to Use Each Metric
Choosing the Right Technical Metric
- BLEU: Best for machine translation and comparing multiple candidates
- GLEU: Better for task-specific evaluation with more nuanced grading
- ROUGE: Ideal for summarization and information retrieval tasks
- METEOR: Excellent for understanding semantic similarity and synonym variations
- Perplexity: Most comprehensive for overall language model quality assessment
Practical Application
For most AI assistant implementations, a combination of metrics provides the most accurate picture: Use METEOR for semantic understanding, Perplexity for baseline model quality, and ROUGE if your assistant involves text generation or summarization.
04. Metrics for LLM-Based Search
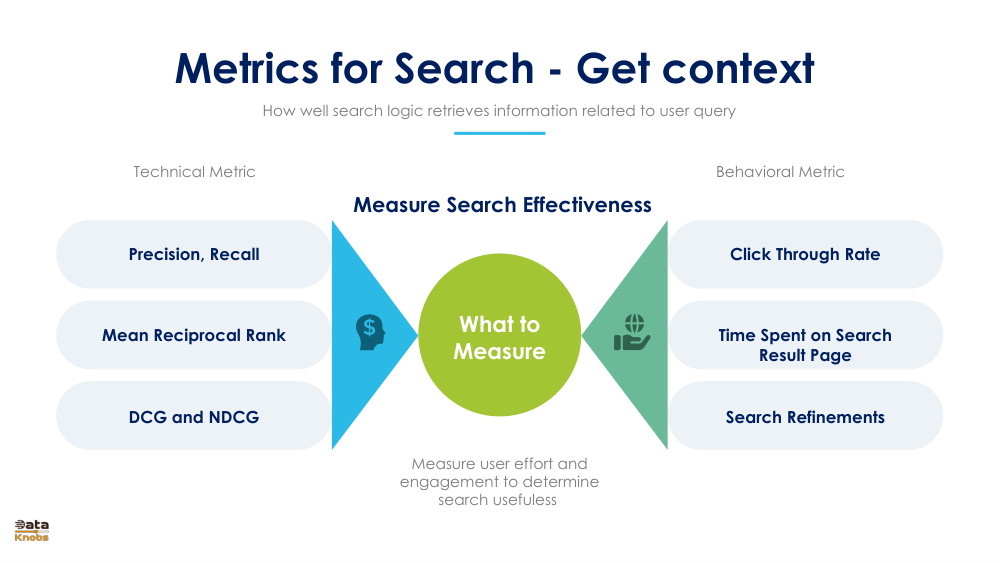
Search is a critical component of many AI assistants, helping them retrieve relevant information from knowledge bases. Evaluating search effectiveness requires both technical metrics (how well items are ranked) and behavioral metrics (how users interact with results).
Technical Metrics for Search
Technical
Precision & Recall — Precision: % of returned results that are relevant. Recall: % of all relevant documents that were retrieved. Balance between both is critical.
Technical
Mean Reciprocal Rank — Average position of the first relevant result in the search results. Higher MRR means relevant items appear earlier — critical for search quality.
Technical
DCG & NDCG — Discounted Cumulative Gain measures ranking quality, accounting for position. Higher relevance items should rank higher. NDCG normalizes across queries.
Behavioral Metrics for Search
Behavioral
Click-Through Rate — Percentage of users clicking on search results. High CTR indicates users find results relevant. Low CTR suggests search quality issues.
Behavioral
Time on Result Page — How long users spend browsing search results. Longer times may indicate difficulty finding needed information.
Behavioral
Search Refinements — Number of search query modifications users make. High refinement rates indicate initial results weren't satisfactory.
Optimal Search Performance
Aim for high precision (90%+) paired with good recall (75%+), high click-through rates (15-25%), and low refinement rates (< 20% of searches requiring modification). These indicate effective information retrieval.
05. Metrics for LLM-Based Recommendation
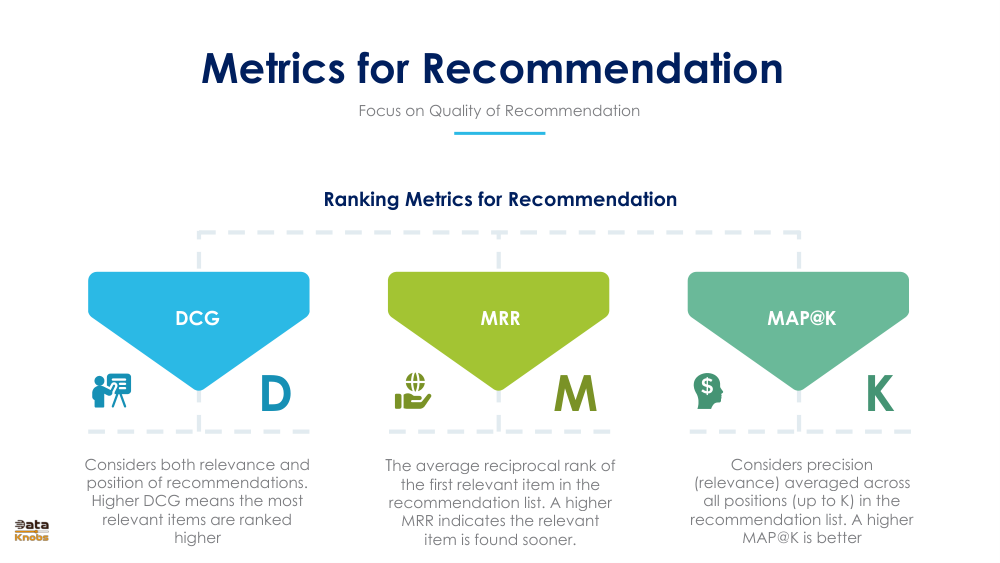
Recommendation is a sophisticated AI assistant capability. It requires measuring both the quality of ranking (technical metrics) and the real-world impact on users (behavioral metrics).
Ranking Metrics for Recommendation Quality
Technical
DCG (Discounted Cumulative Gain) — Considers both relevance and position of recommendations. Higher DCG means most relevant items are ranked at the top, providing better user experience.
Technical
MRR (Mean Reciprocal Rank) — Average reciprocal rank of the first relevant item. Measures how soon users find what they're looking for. Higher MRR indicates better ranking.
Technical
MAP@K (Mean Average Precision) — Precision averaged across all positions up to K items. Balances relevance with position. Higher MAP@K indicates better overall recommendation quality.
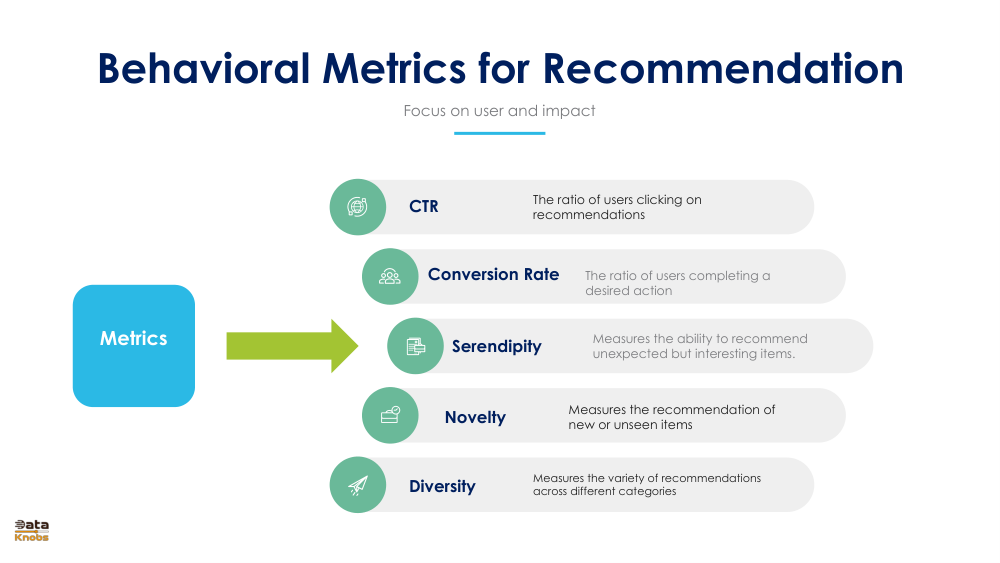
Behavioral Metrics for Recommendation Impact
Behavioral
Click-Through Rate (CTR) — Ratio of users clicking on recommendations. Indicates perceived relevance and quality. Typical CTR ranges from 2-10% depending on domain.
Behavioral
Conversion Rate — Ratio of users completing a desired action after clicking a recommendation. Most important for measuring business impact and ROI.
Behavioral
Serendipity — Ability to recommend unexpected but interesting items. Measures how well the system introduces users to new, valuable content they didn't know about.
Behavioral
Novelty — Percentage of recommendations that are new or previously unseen by the user. Balances between personalized and diverse recommendations.
Behavioral
Diversity — Variety of recommendations across different categories. Prevents recommendation echo chambers and broadens user exploration.
Balancing Recommendation Metrics
The Recommendation Metrics Triangle
Recommendation systems must balance three competing objectives:
- Relevance: Recommend items users will like (DCG, MRR, CTR)
- Novelty: Introduce new items users haven't seen (Novelty, Serendipity)
- Diversity: Show variety across categories (Diversity, Serendipity)
High-performing systems optimize all three — recommend highly relevant items while introducing serendipitous discoveries and maintaining category diversity.
06. Comprehensive Evaluation Framework
Metrics by AI Assistant Type
| Assistant Type | Primary Metrics | Secondary Metrics | Success Indicators |
|---|---|---|---|
| Search Assistant | Precision, Recall, CTR | NDCG, Response Time | Precision >90%, CTR >10% |
| Q&A Assistant | Accuracy, Completeness, Task Completion | METEOR, Response Time | Accuracy >90%, Completion >80% |
| Recommendation Assistant | DCG, Conversion Rate, CTR | Novelty, Diversity | CTR >5%, Conversion >2% |
| Support Assistant | Self-Service Rate, Satisfaction, Task Completion | Conversation Length, Engagement | Self-Service >70%, Satisfaction >75% |
| Planning Assistant | Plan Feasibility, Task Completion, User Satisfaction | Conversation Length, Engagement | Plan Completion >80%, Satisfaction >75% |
Building Your Metrics Dashboard
Essential Metrics to Track Always
- Quality Task Completion Rate - Shows if your assistant actually helps
- Quality User Satisfaction - Indicates perceived value
- Quality Response Accuracy - Critical for trust and credibility
- Quality Response Time - Impacts user experience
- Quality Self-Service Rate - Reduces operational costs
- Quality Cost per Interaction - Ensures business viability
Metrics Implementation Timeline
Phase 1: Launch (Week 1-2)
Track basic metrics: Task completion, satisfaction, conversation length. Establish baseline performance.
Phase 2: Optimization (Week 3-8)
Add response quality metrics. Identify problem areas. Begin A/B testing improvements.
Phase 3: Advanced (Week 9+)
Implement technical metrics. Use feature-specific metrics (search, recommendation, etc.)
Phase 4: Optimization (Ongoing)
Real-time monitoring. Continuous improvement. Predictive analytics for emerging issues.
07. Key Takeaways & Best Practices
What Makes Metrics Effective
- Aligned with Business Goals: Metrics should measure what matters for your business
- User-Centric: Prioritize metrics that reflect actual user experience
- Actionable: Metrics should guide specific improvements and decisions
- Balanced: Combine quality, efficiency, and behavioral metrics for full picture
- Comparable: Track trends over time and compare against benchmarks
The Bottom Line
Successful AI assistants are built on a foundation of comprehensive metrics. Start with user satisfaction metrics, add response quality measures, then layer in technical and behavioral metrics specific to your assistant type. Continuously monitor, analyze, and iterate based on data-driven insights. The best AI assistants aren't built once — they're continuously improved through rigorous measurement and optimization.