From data to decisions
Combine data, logic, and delivery into a reusable product featuring users, ownership, and quantifiable value.
Build for the person making the decision.
A data product is a reusable bundle of data, semantics, logic, and delivery methods created to meet a consumer's requirements. It encompasses ownership, quality management, documentation, and lifecycle processes necessary to maintain the output's long-term usefulness.
This guide accompanies the provided Dataknobs presentation, covering DATSIS, contracts, two learning loops, the Drivetrain method, governance, and a hands-on delivery canvas. Each slide includes a clear explanation alongside its original visual.
The product’s essential commitments
| Dimension | Question to answer |
|---|---|
| Consumer | Who uses it, and which decision does it support? |
| Ownership | Which team maintains quality and handles change? |
| Contract | What do fields mean, and what service levels are promised? |
| Delivery | How can consumers discover and access the output? |
| Value | What evidence shows adoption and better outcomes? |
| Lifecycle | How will the product evolve, version and retire? |
Browse all 26 slides
01 · Data Product 101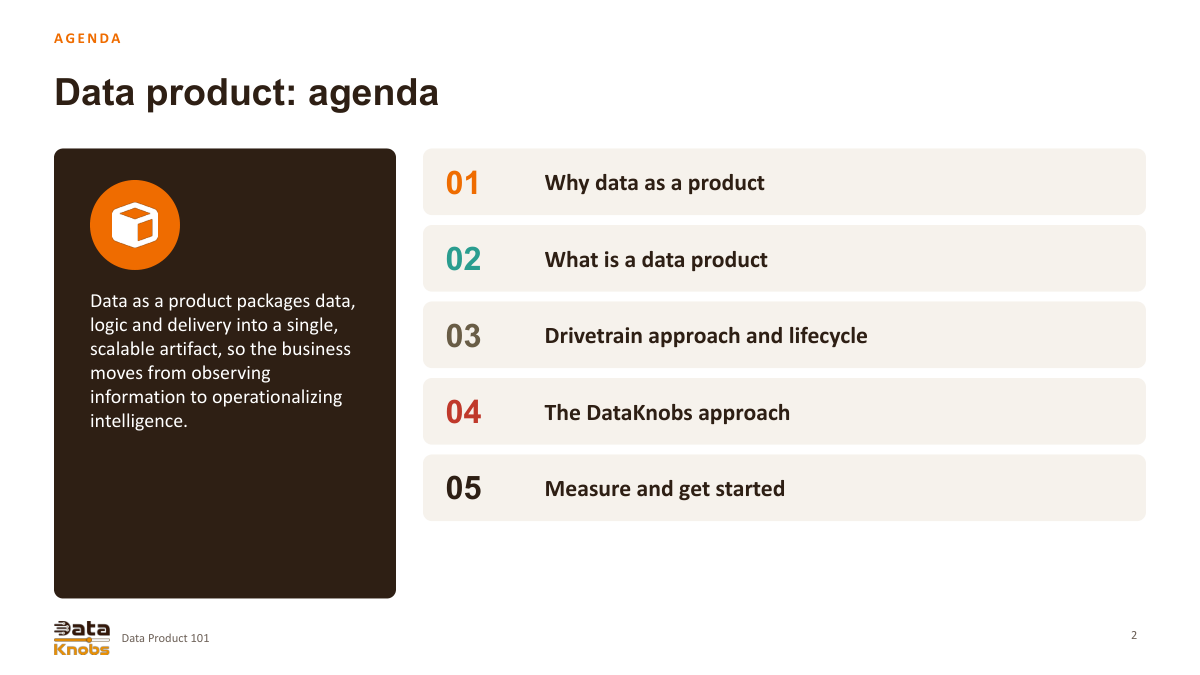 02 · From information to operational intelligence
 03 · Data as a product
 04 · Project mindset versus product mindset
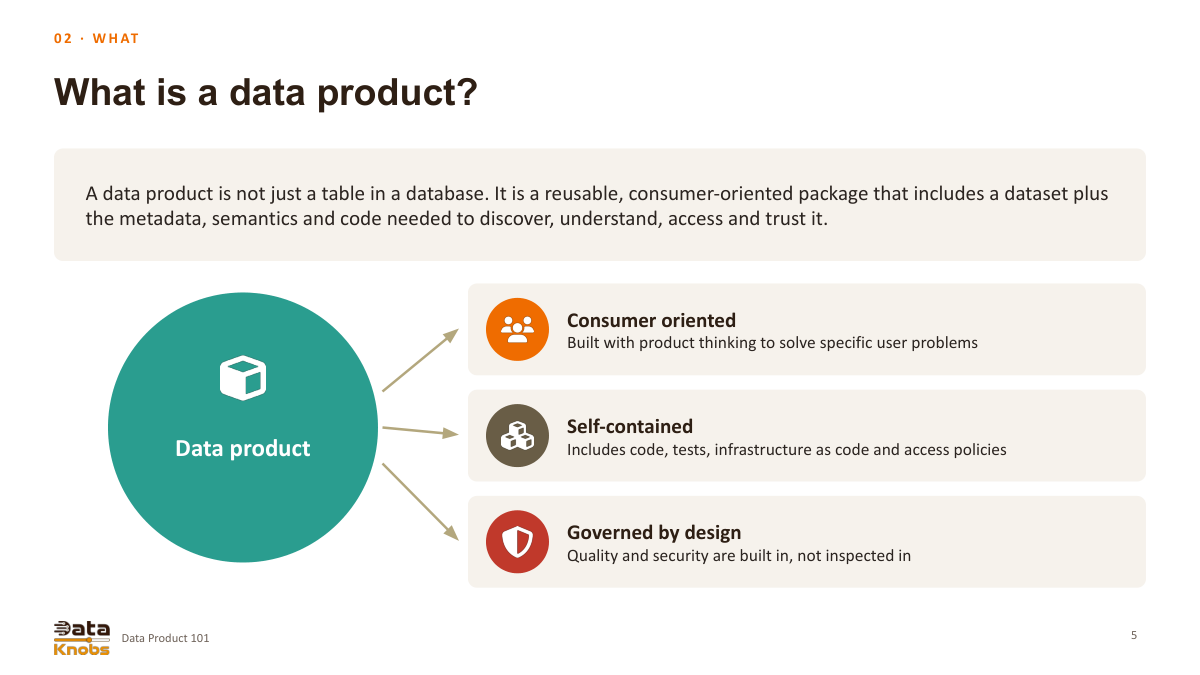 05 · What a data product contains
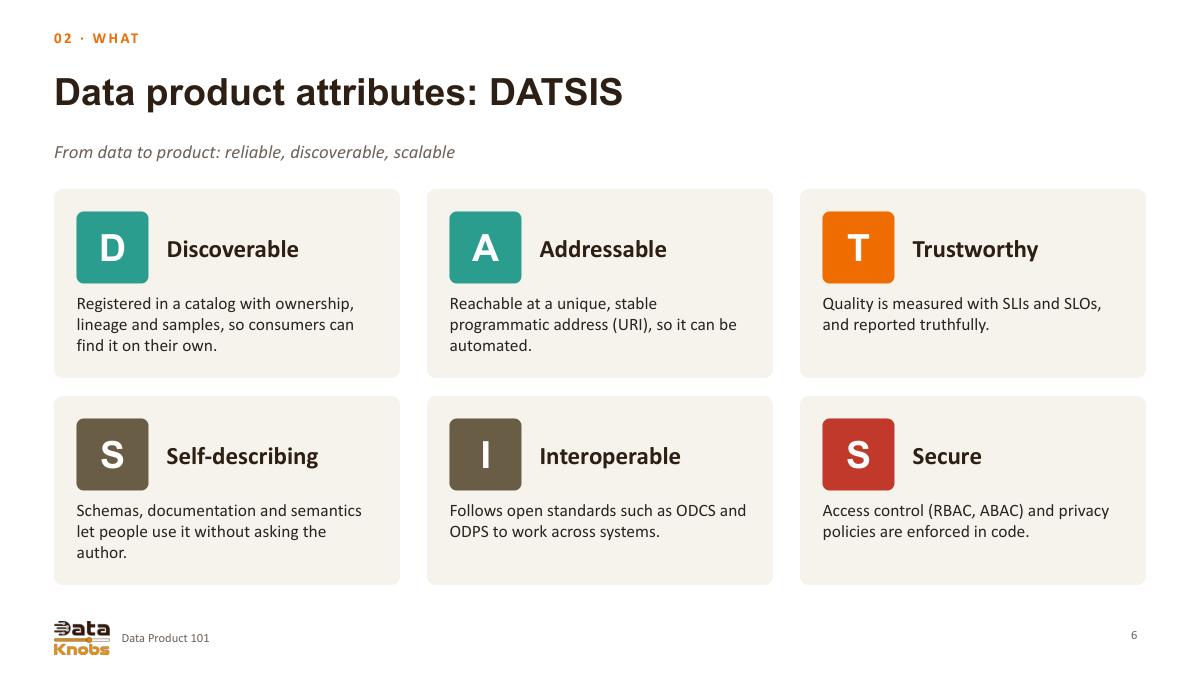 06 · DATSIS attributes
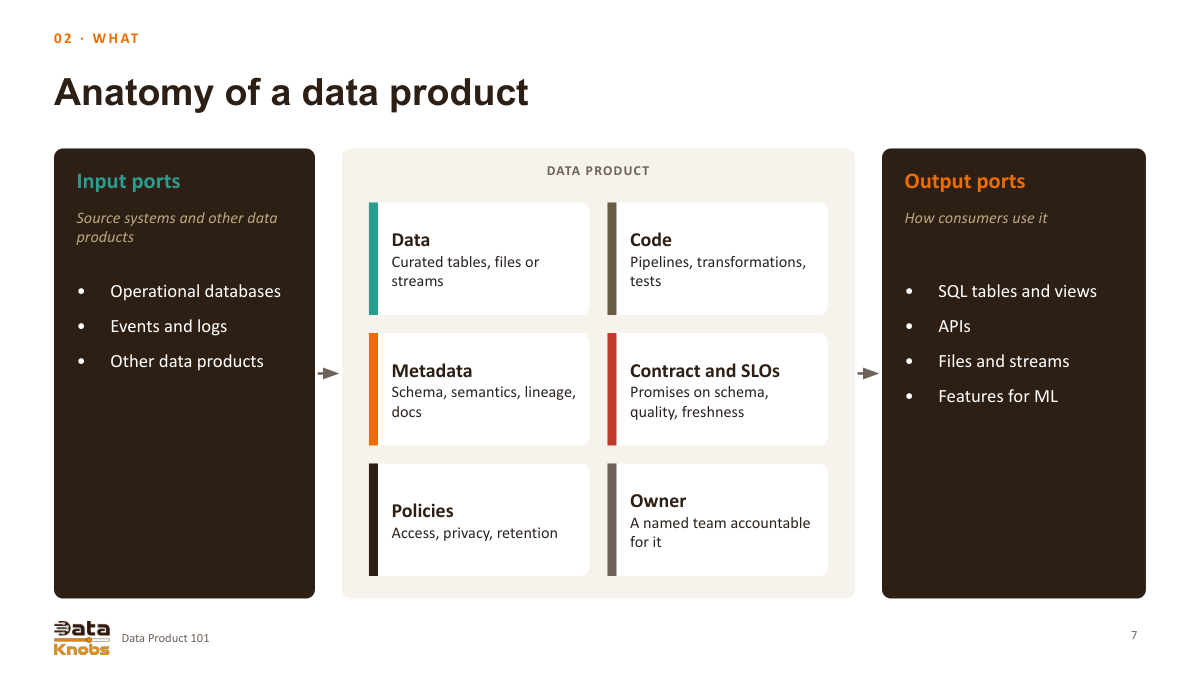 07 · Anatomy: inputs, internals and outputs
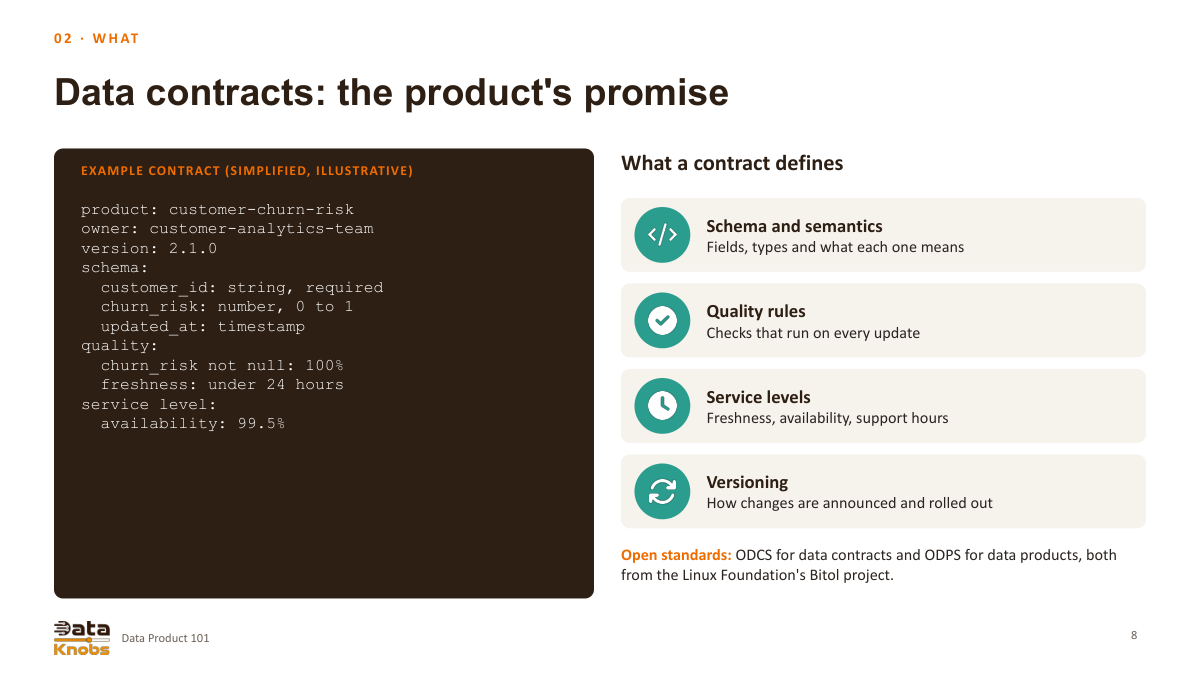 08 · The data contract
 09 · Software and data product quality
 10 · Validate both technology and usefulness
 11 · Two learning loops
 12 · The Drivetrain approach
 13 · Ownership and governance options
 14 · Manage the full lifecycle
 15 · The Dataknobs approach
 16 · Start with who decides
 17 · Close the user feedback loop
 18 · Know more, risk less, do better
 19 · Build reusable business concepts
 20 · Curate a trusted gold dataset
 21 · Six ways to assess value
 22 · Monitor product health
 23 · Worked customer-churn canvas
 24 · Common pitfalls
 25 · An illustrative first 90 days
 26 · From artifact to maintained outcome
Why products: and what they contain
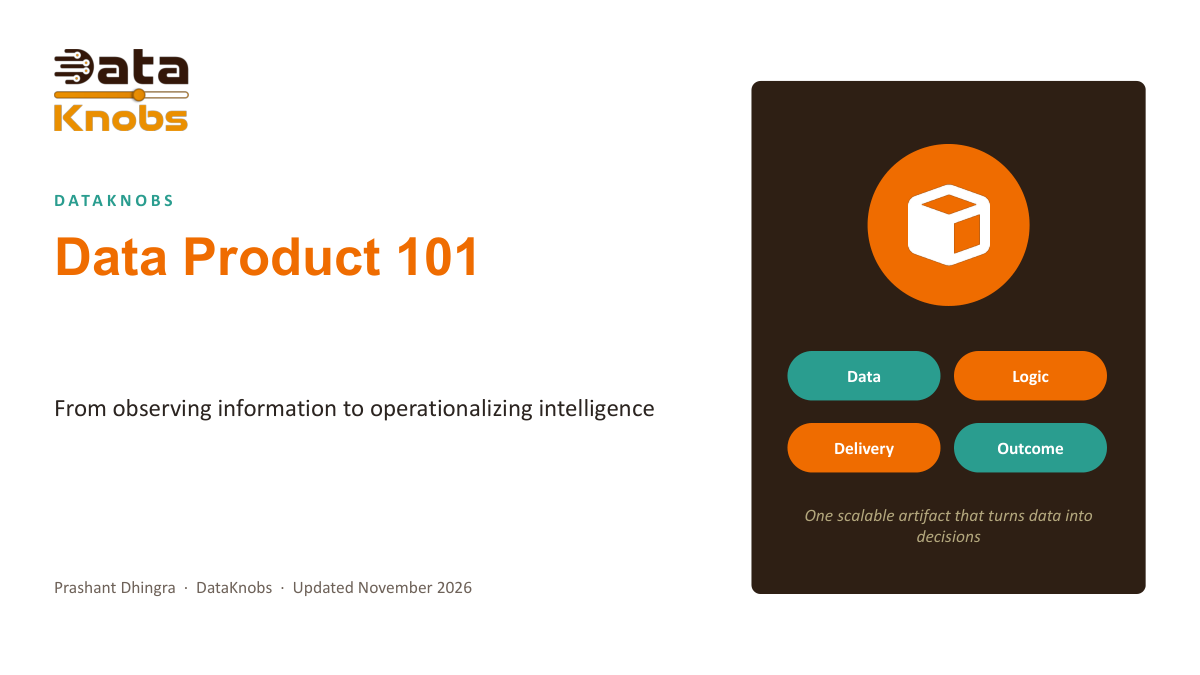
Data Product 101
A data product combines data, logic, and delivery to enable a valuable decision or action. The Dataknobs method links a reusable technical component with users, ownership, quality assurances, and measurable results.
From information to operational intelligence
This guide explains the importance of product thinking, outlines what constitutes a data product, describes the Drivetrain approach, covers lifecycle management, introduces the Dataknobs method, and discusses ways to measure value. The emphasis is on a sustained capability that users can find, comprehend, and utilize.
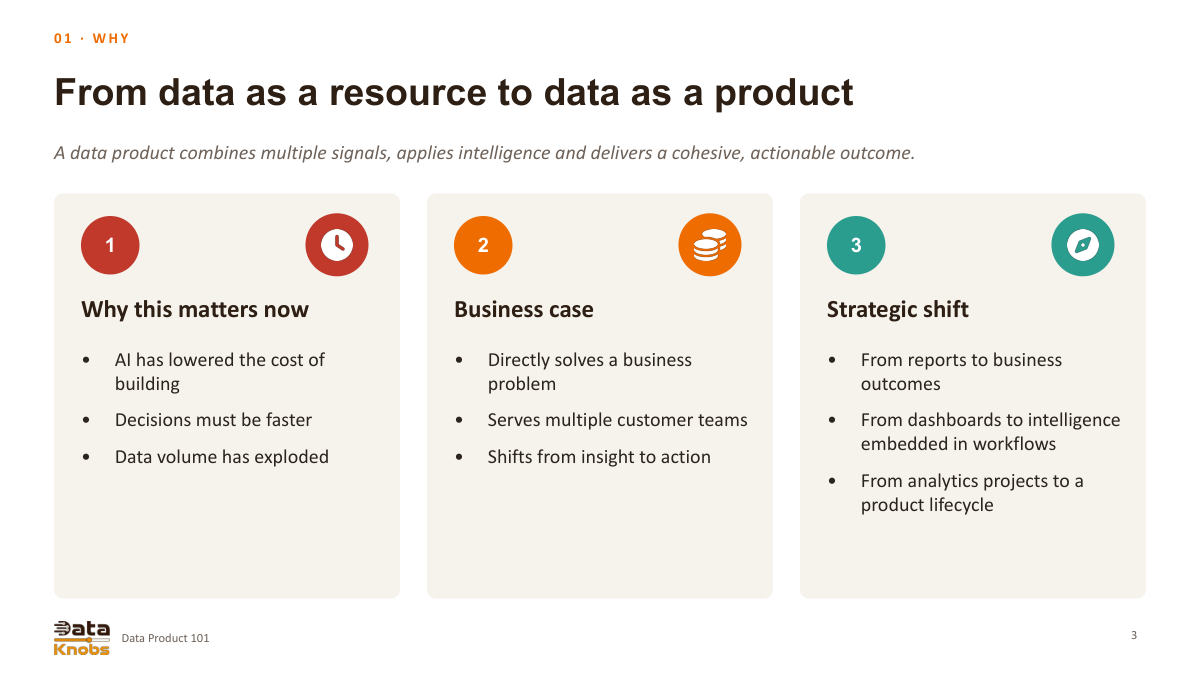
Data as a product
Integrating signals with business logic enables the transformation of information into decisions and workflows. Product thinking focuses on the problem addressed, the users served, and ongoing improvement. Rapid implementation by itself does not guarantee usefulness or dependability.
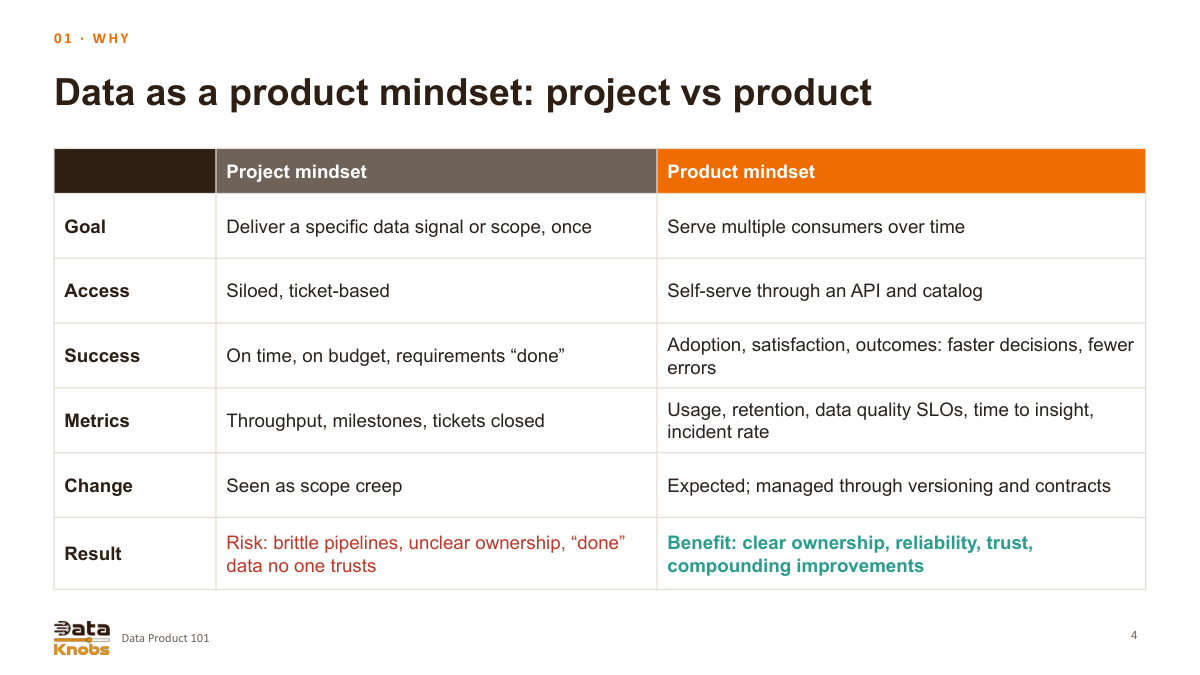
Project mindset versus product mindset
A project provides a specified scope, whereas a product serves users throughout its lifecycle. Adoption, satisfaction, quality, and results enhance delivery milestones. Versioning, support, and clear ownership facilitate managing continuous changes rather than viewing each new requirement as unforeseen scope.
What a data product contains
A consumer-focused data product integrates reusable data with metadata, semantics, code, and access methods. Testing, policies, and infrastructure enable discovery, understanding, and trust. While a table may serve as an output, the product also encompasses the associated commitments and operational procedures.
DATSIS attributes
The deck outlines six design attributes: discoverable, addressable, trustworthy, self-describing, interoperable, and secure. These attributes are made tangible through catalog registration, stable interfaces, measurable quality, documented meaning, compatible standards, and enforced access controls.
Anatomy: inputs, internals and outputs
Input ports link source systems or other products. Internally, they contain curated data, transformation code, metadata, contracts, policies, and a designated owner. Output ports can provide SQL views, APIs, files, streams, or ML features, allowing various consumers to utilize the same managed capability.
The data contract
A contract specifies the definition of fields, schema, quality rules, service levels, and change management. The 24-hour freshness and 99.5% availability in the customer-churn example represent illustrative targets, not actual measured outcomes. The presentation references ODCS and ODPS as standards to evaluate; explicitly choose and version the specification you adopt.
Software and data product quality
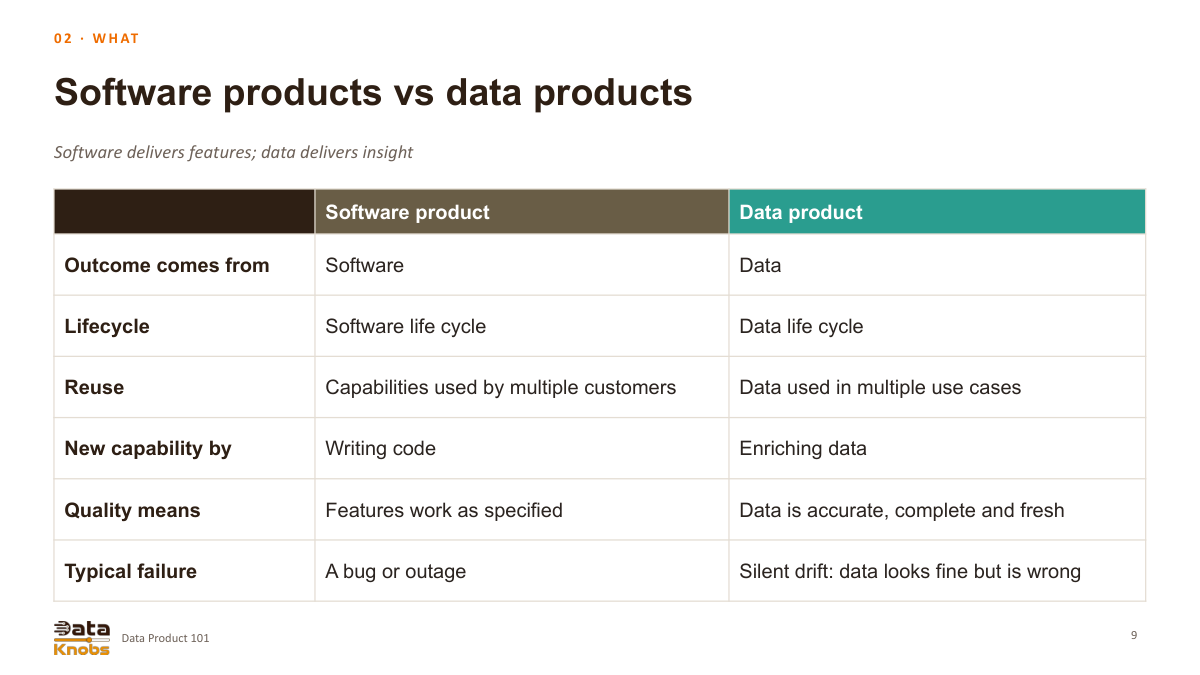
The slide compares software features with data-driven outputs. In reality, data products rely on software engineering, and software products often depend significantly on data. Data quality introduces additional issues like freshness, semantics, and unnoticed distribution shifts, in addition to bugs and outages.
Experiment, govern and operate
Validate both technology and usefulness
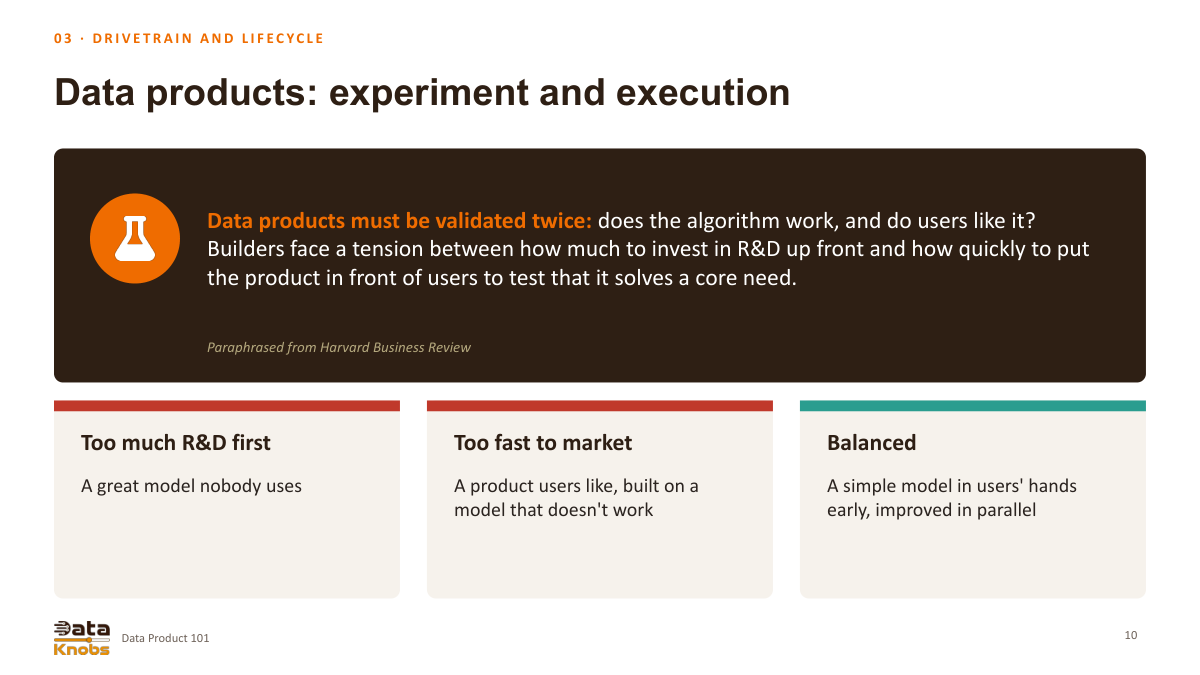
A technically robust model might remain unused, whereas a widely favored prototype could be unreliable. Deliver a limited, comprehensible capability to users early on, while simultaneously enhancing technical quality. User excitement or offline performance by itself does not guarantee success.
Two learning loops
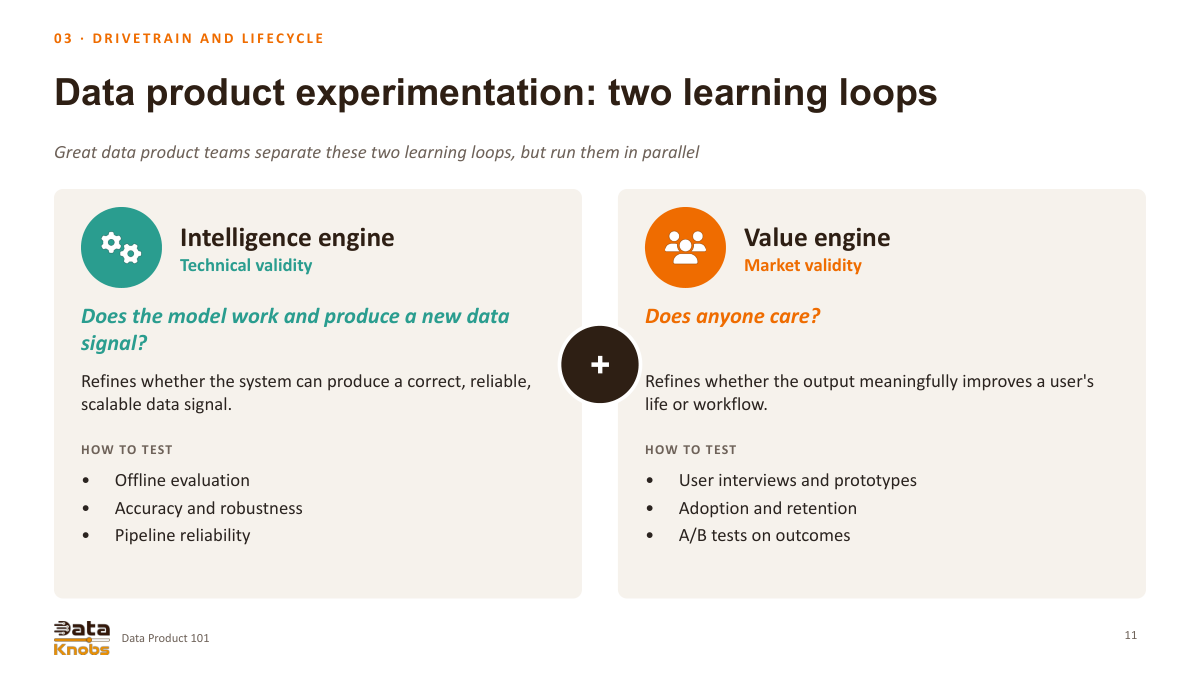
The intelligence loop assesses if a signal is accurate, dependable, and functionally reliable. The value loop examines whether users embrace it and attain improved results. Offline evaluations, prototypes, interviews, and well-structured experiments address distinct questions and should guide one another.
The Drivetrain approach
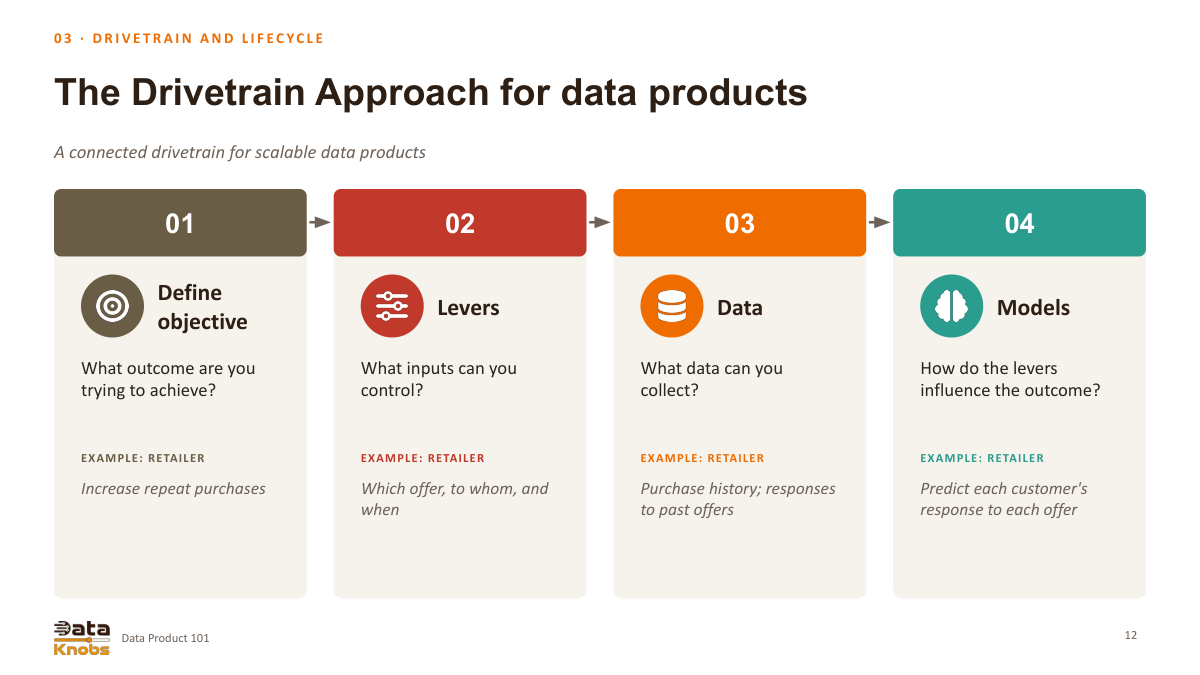
Begin by defining a clear objective, pinpoint controllable levers, identify necessary data, and then select appropriate models. In the retailer scenario, the objective is repeat purchases, with offer selection as a lever. While predicting response is helpful, assessing an offer’s incremental impact demands an appropriate causal evaluation approach.
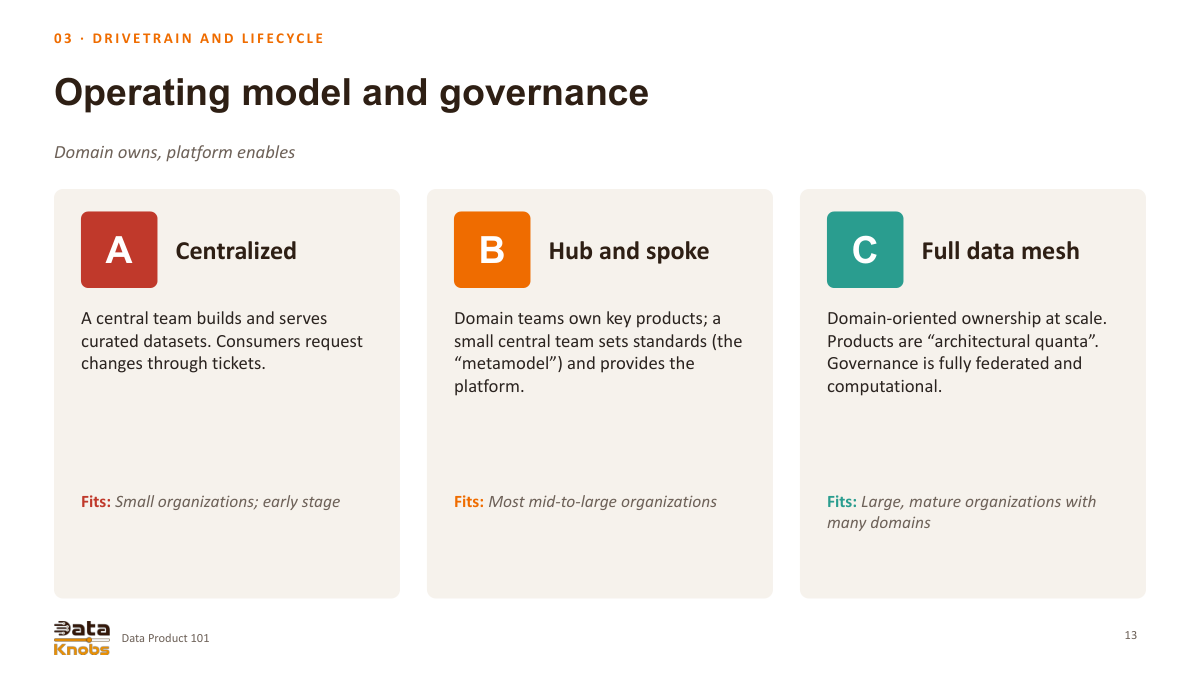
Ownership and governance options
The deck contrasts centralized delivery, hub-and-spoke ownership, and a more federated data-mesh model. The suitable approach depends on domain expertise, platform development, and coordination requirements. Organizational size by itself does not dictate the best fit.
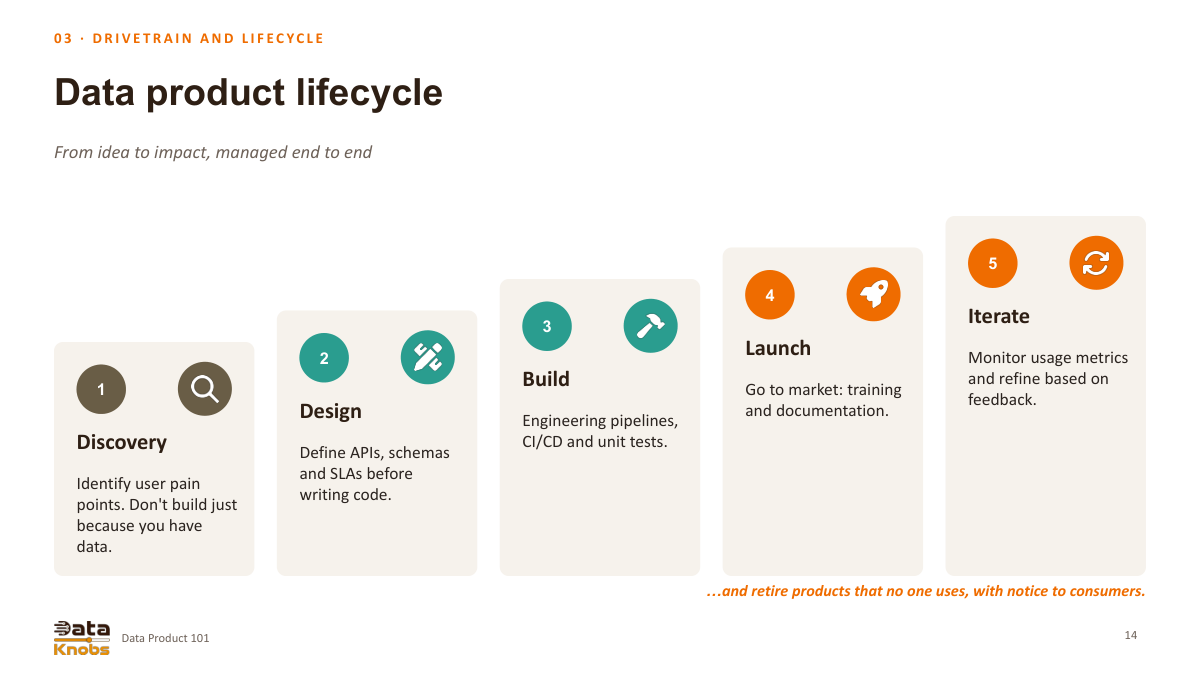
Manage the full lifecycle
Identify a genuine need, create interfaces and agreements, develop and test, release with documentation and training, then observe and refine. Incorporate deprecation and retirement along with consumer notification to prevent unused or outdated products from becoming ongoing maintenance liabilities.
Connect users, tasks and reusable concepts
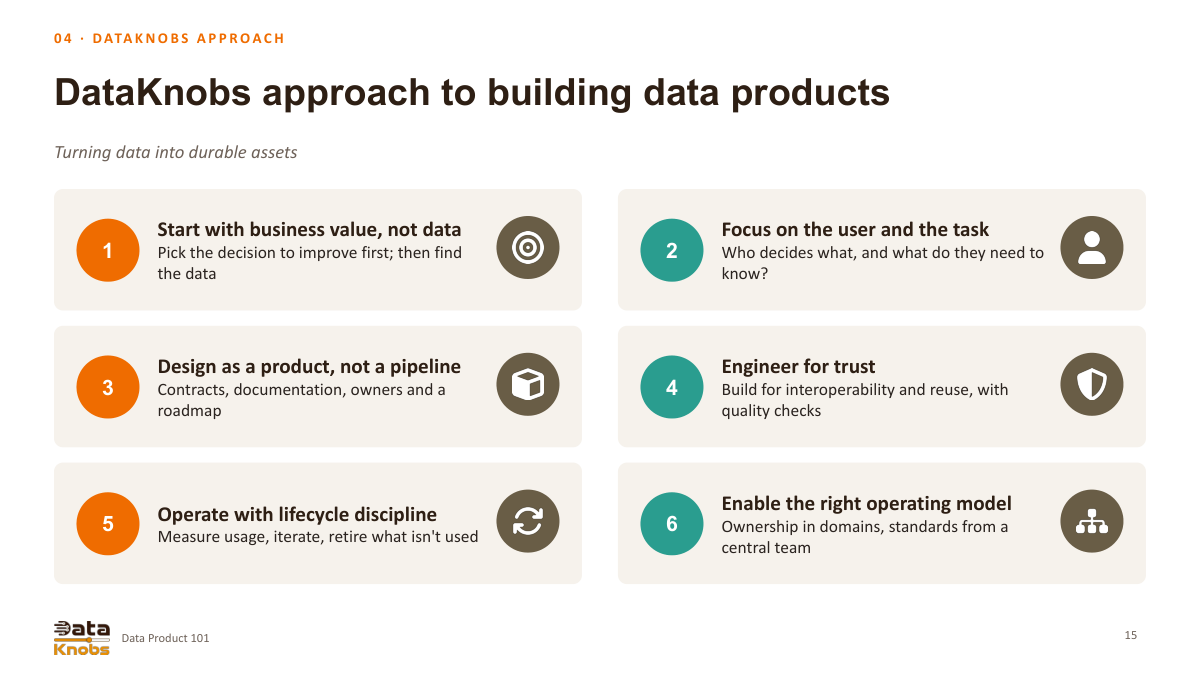
The Dataknobs approach
Begin with business value and the user’s task, create a product rather than just a pipeline, build for trust, manage throughout its lifecycle, and select practical ownership. This method maintains decision usefulness linked to contracts, quality, documentation, and reuse.
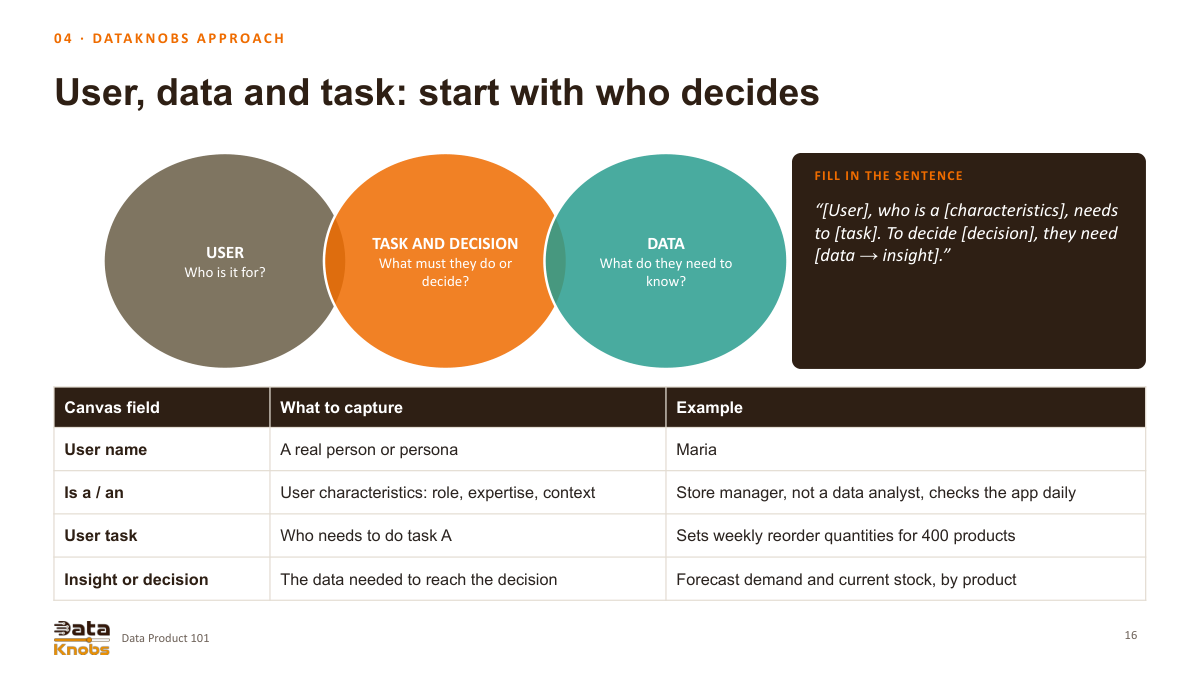
Start with who decides
The user-task canvas outlines a person or role, their context, the task, the decision involved, and the required evidence. In the store-manager example, demand forecasts and current stock levels are necessary to determine reorder quantities. This approach simplifies validating the intended action and interface.
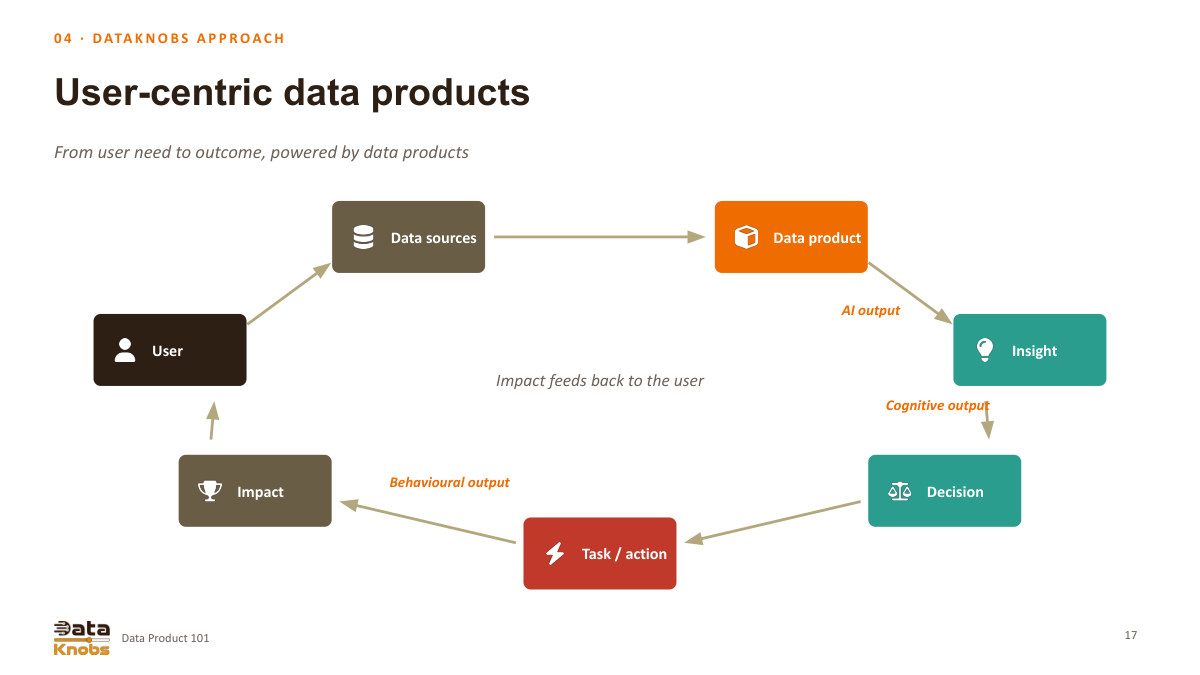
Close the user feedback loop
Data serves as input for a product, generating an output that drives insight, decisions, and actions. The impact produced should be used to reassess the product. Creating a score is just a step in the process; the key outcome to evaluate is whether the score enhances the user’s task.
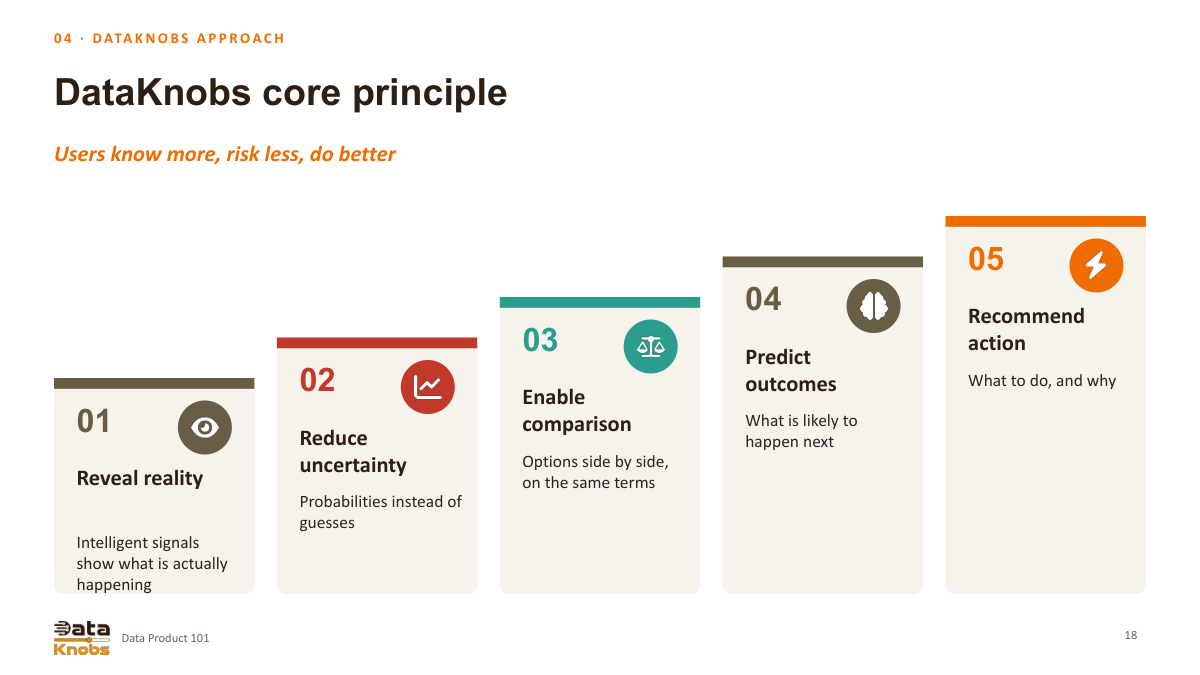
Know more, risk less, do better
The deck’s flow advances from presenting current conditions to lessening uncertainty, evaluating alternatives, forecasting results, and suggesting actions. Each successive stage demands evidence appropriate to its assertion. A recommendation ought to clarify assumptions and constraints instead of suggesting certainty based on a prediction.
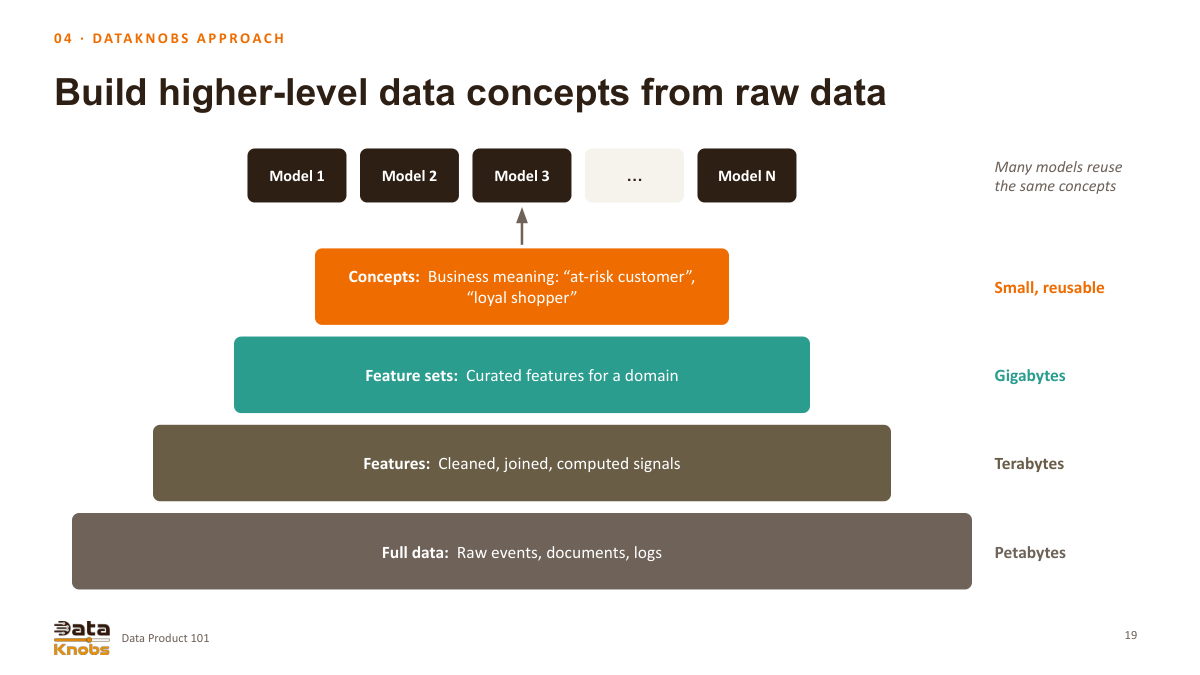
Build reusable business concepts
Convert raw events into verified features, domain-specific feature sets, and common concepts like an at-risk customer. Reuse relies on consistent semantics, ownership, and context. The storage sizes presented in the slide represent a hierarchy rather than fixed volume requirements.
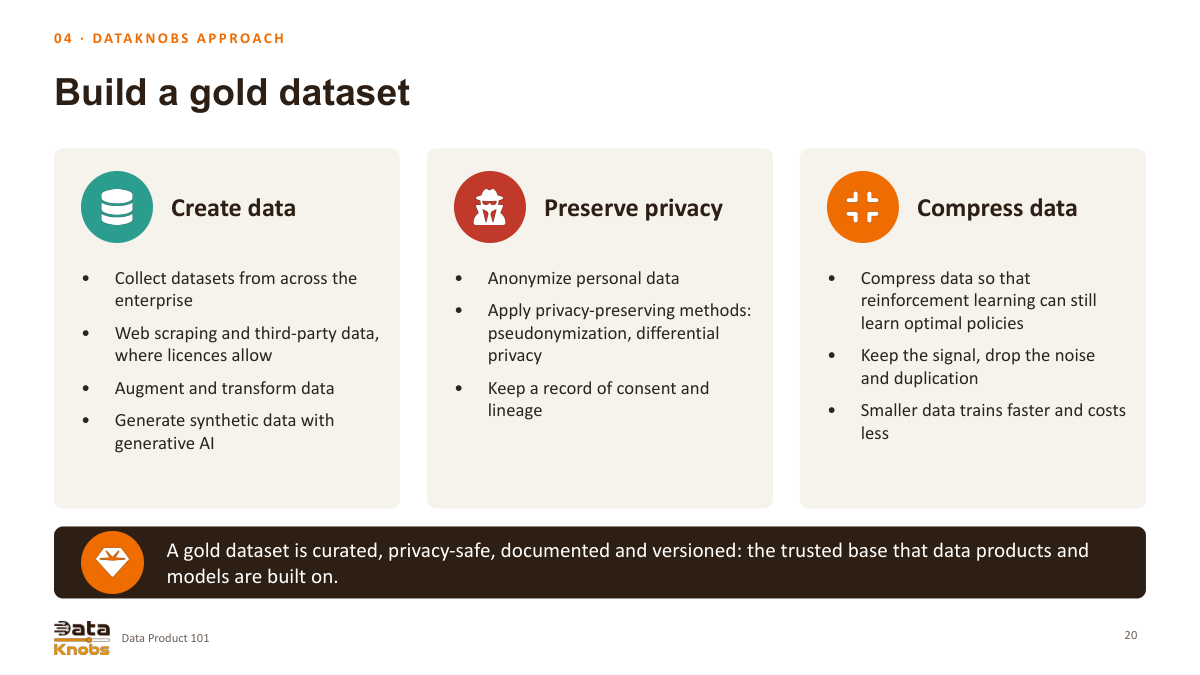
Curate a trusted gold dataset
Document and version collected, transformed, or synthetic data, including provenance, permitted usage, and quality assessments. Pseudonymization differs from anonymization, and synthetic data generation by itself does not ensure privacy. Compression and reduction techniques should be assessed based on the retained task-relevant information rather than presumed to maintain optimal decision-making.
Measure outcomes and launch with discipline
Six ways to assess value
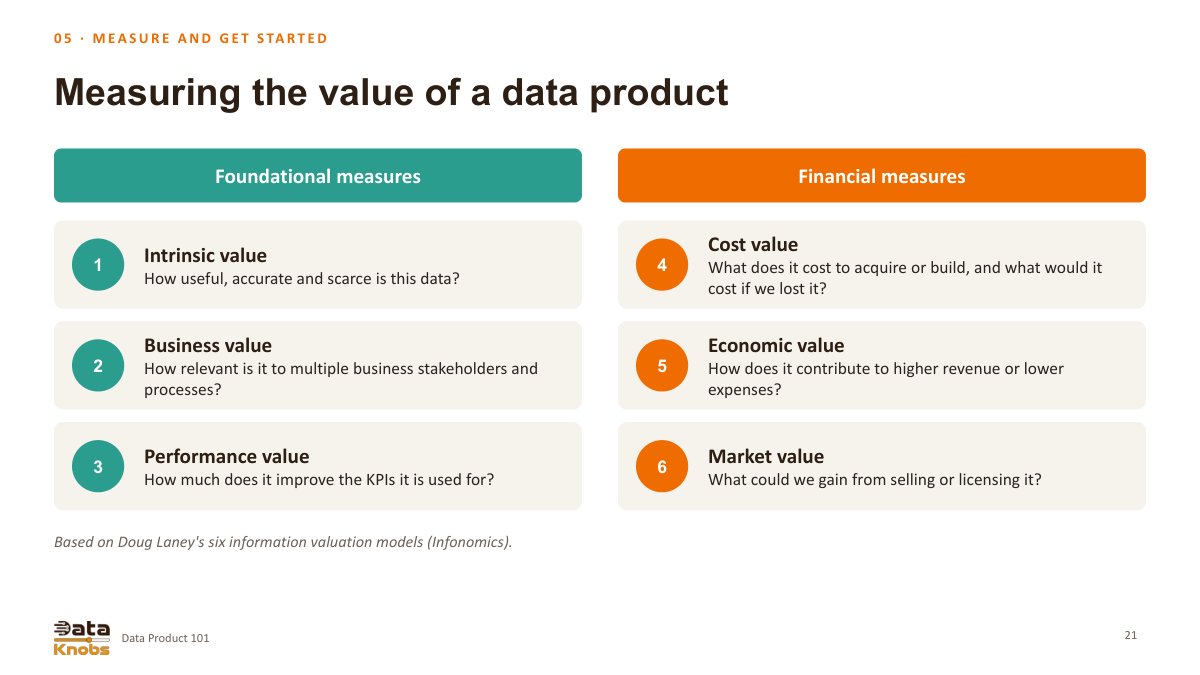
The deck incorporates intrinsic, business, performance, cost, economic, and market viewpoints derived from information valuation. Take into account usefulness, organizational significance, measurable KPI impacts, acquisition and recovery costs, revenue or expense influence, and allowable external value. Ensure the same benefit is not counted multiple times across categories.
Monitor product health
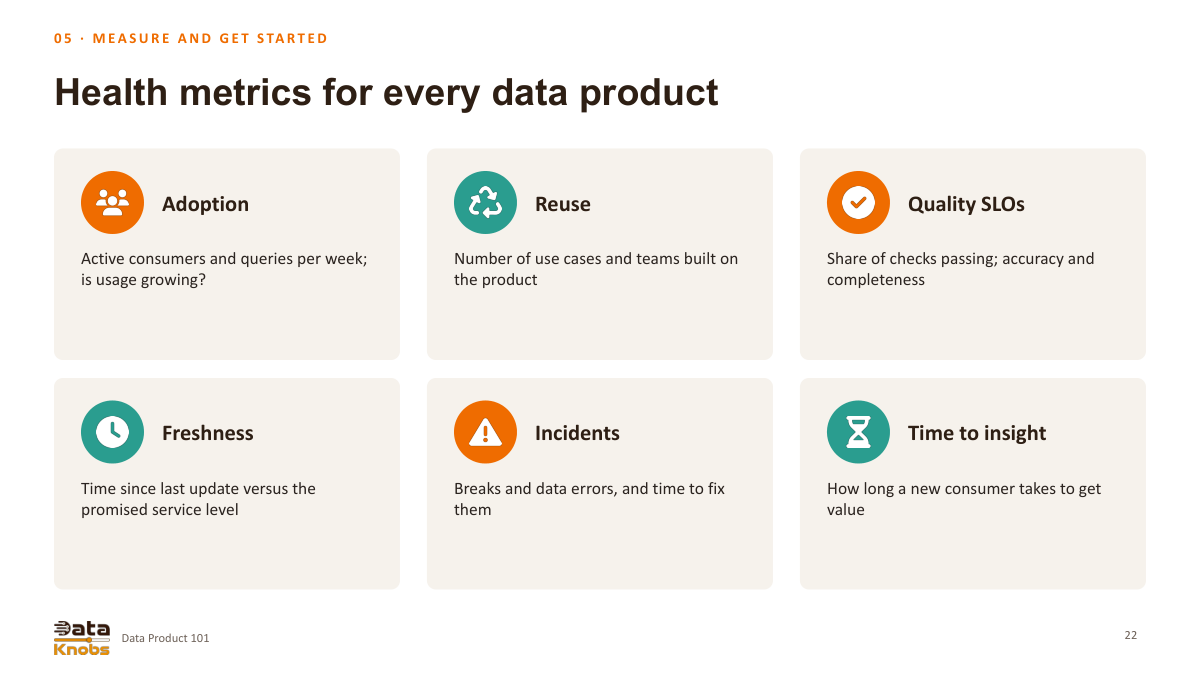
Monitor active users, reuse rates, quality outcomes, freshness, incidents, and time to initial valuable result. Define metrics and their denominators clearly. While query volume indicates usage, it must be considered in context with user requirements, system reliability, and demonstrated benefits.
Worked customer-churn canvas
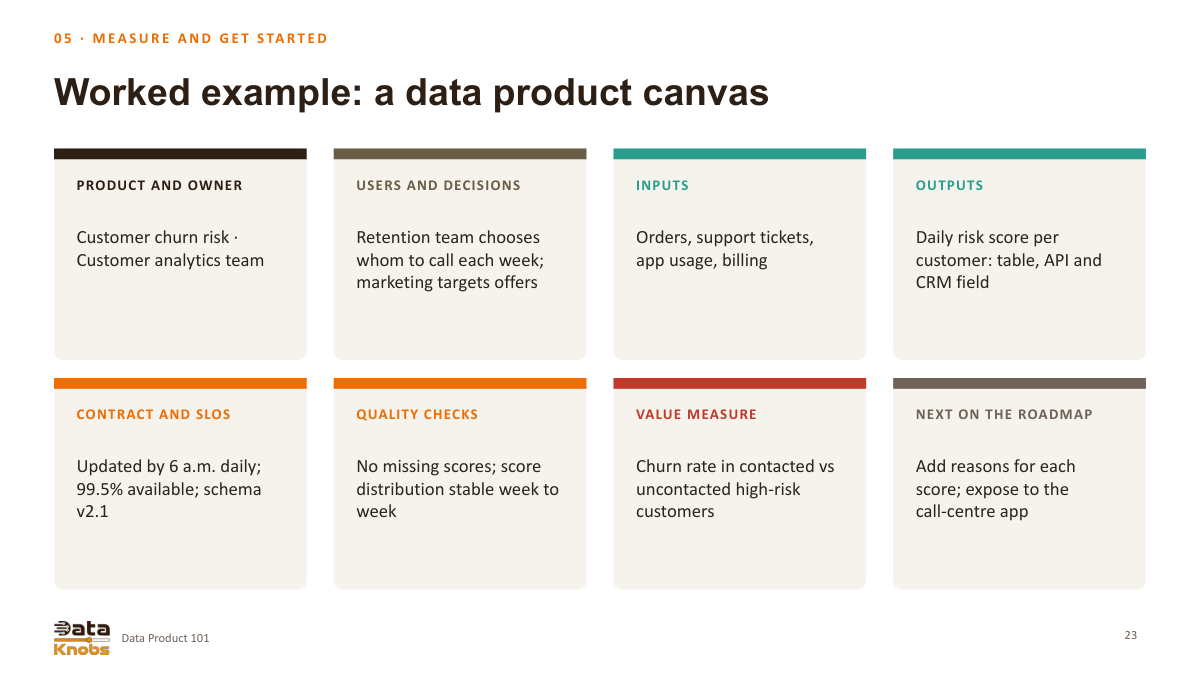
The example product delivers daily risk scores via a table, API, and CRM field, each managed by a designated analytics owner. Its service levels and schema serve as examples. Comparing contacted versus uncontacted customers may be confounded; employ randomized outreach or another robust design to assess the effect of interventions.
Common pitfalls
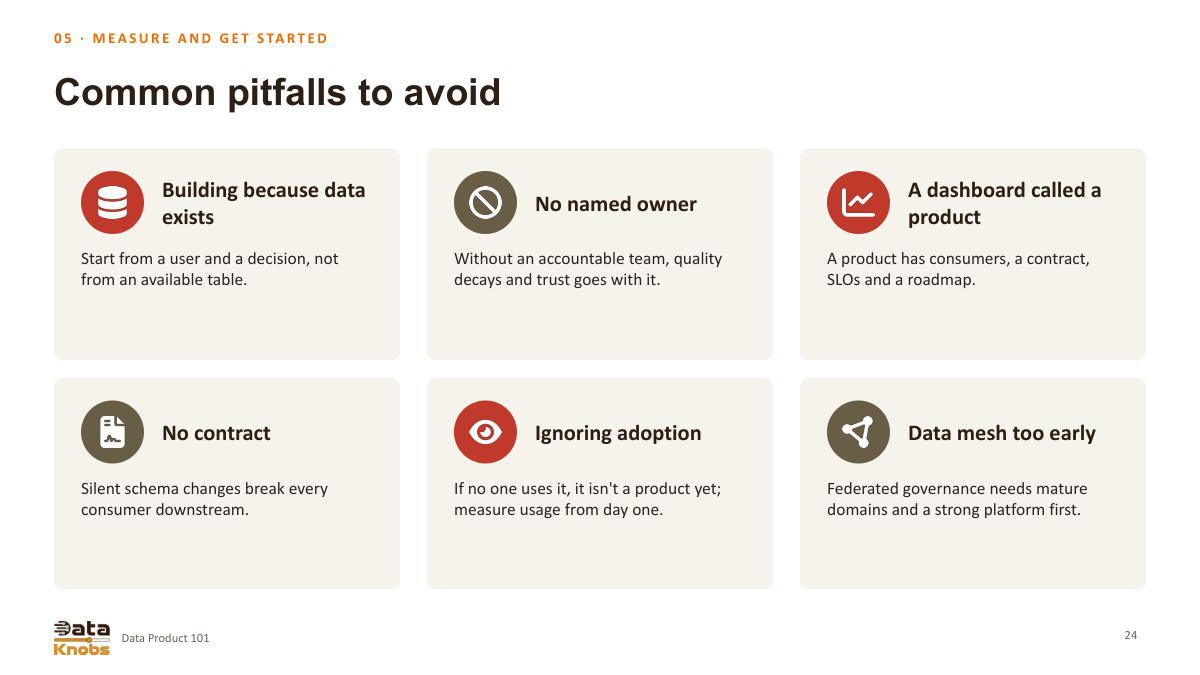
Do not create solutions just because data is available, assume ownership without clarity, label an unsupported dashboard as a product, alter schemas without notification, overlook adoption, or federate before teams are prepared. A dashboard qualifies as a genuine product only when users, contracts, and lifecycle management are properly established.
An illustrative first 90 days
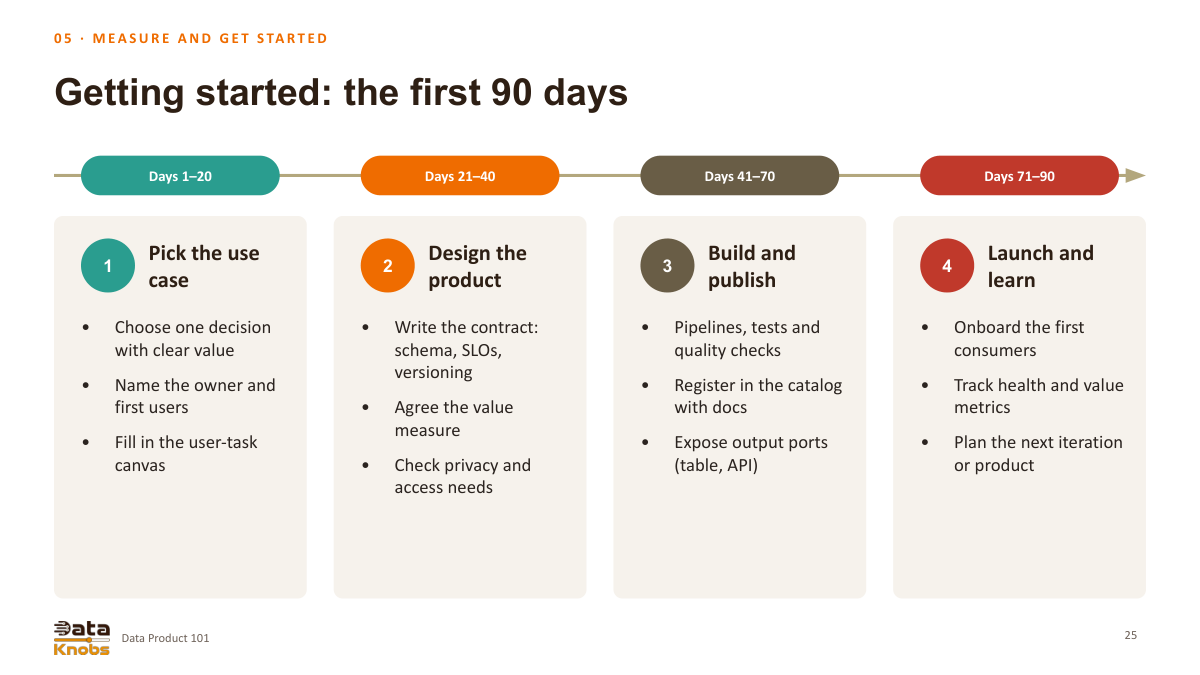
Identify a key decision and its owner, create the contract and value metrics, establish quality checks and output interfaces, then onboard users and gather insights. The suggested 90-day timeline is a planning illustration, not a promise of delivery; progress depends on scope and data availability.
From artifact to maintained outcome
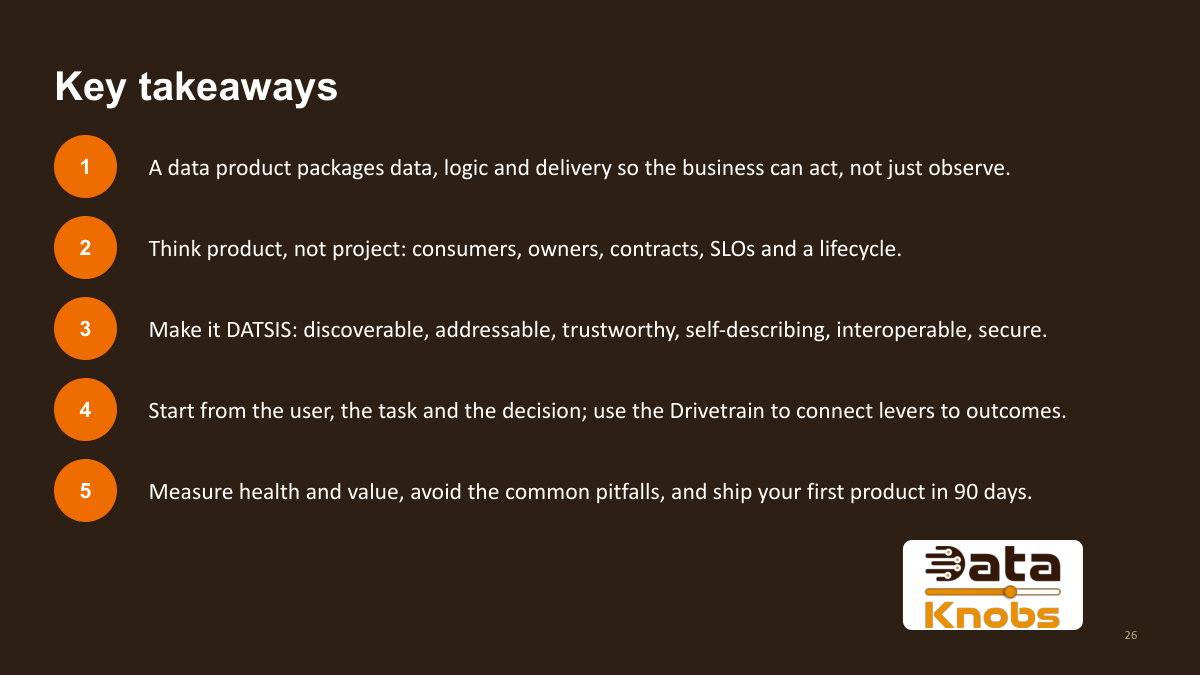
Combine data with logic and delivery, identify consumers and owners, clearly state quality and access commitments, and link the user’s task to measurable outcomes. A sustainable data product merges engineering dependability with proof that it supports decision-making or action.
Data product FAQ
What is a data product?
A consumer-focused data product integrates reusable data with metadata, semantics, code, and access methods. Testing, policies, and infrastructure enable discovery, understanding, and trust. While a table may serve as an output, the product also encompasses the associated commitments and operational procedures.
What does DATSIS stand for?
Discoverable, addressable, trustworthy, self-describing, interoperable, and secure. These qualities are used in the deck to steer the design of data products.
How is a data product different from a project?
A project provides a specified scope, whereas a product serves users throughout its lifecycle. Adoption, satisfaction, quality, and results enhance delivery milestones. Versioning, support, and clear ownership facilitate managing continuous changes rather than viewing each new requirement as unforeseen scope.
What belongs in a data contract?
Schema and semantics, quality standards, freshness and availability guarantees, ownership, support requirements, and a versioning policy. The contract must be testable and updated as the product evolves.
What is the Drivetrain approach?
Begin by defining a clear objective, pinpoint controllable levers, identify necessary data, and then select appropriate models. In the retailer scenario, the objective is repeat purchases, with offer selection as a lever. While predicting response is helpful, assessing an offer’s incremental impact demands an appropriate causal evaluation approach.
How should a team measure success?
Monitor active users, reuse rates, quality outcomes, freshness, incidents, and time to initial valuable result. Define metrics and their denominators clearly. While query volume indicates usage, it must be considered in context with user requirements, system reliability, and demonstrated benefits.
About this guide
Based on the provided 26-slide “Data Product 101” presentation by Prashant Dhingra from DataKnobs, marked as updated in November 2026. This deck serves as the foundation for the DataKnobs methodology, including its canvases, examples, and suggested delivery order.
The provided service levels, storage capacities, and timelines are illustrative examples rather than guaranteed product specifications. The accompanying notes differentiate privacy techniques and emphasize the importance of a sound evaluation design when assessing business impact.