Why Data Fallacies Matter
Flawed data analysis leads to flawed decisions
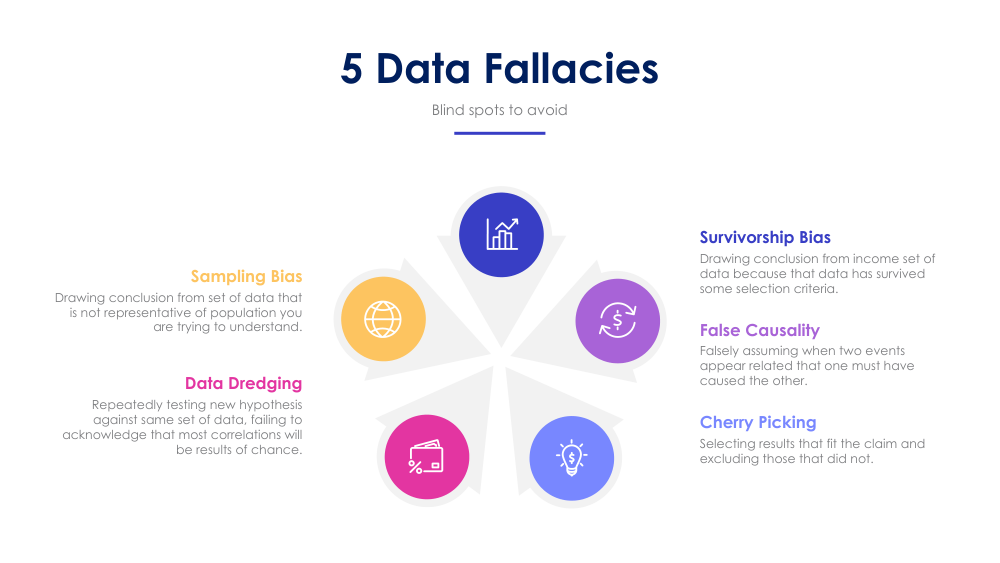
Five critical blind spots in data analysis to avoid
The Truth: We live in a data-driven world, but data can lie. Not intentionally::but through flawed analysis, biased sampling, and logical errors. Understanding these five fallacies is essential for anyone making decisions based on data.
The Cost of Getting It Wrong
Data fallacies lead to:
- ✗ Wrong business decisions that waste resources and hurt profitability
- ✗ False confidence in conclusions that aren't actually supported by data
- ✗ Policy mistakes that affect people's lives (healthcare, finance, criminal justice)
- ✗ Reputation damage when faulty analyses are exposed
The Five Fallacies
Critical blind spots to recognize and avoid
Sampling Bias
Drawing conclusions from a set of data that is not representative of the population you are trying to understand.
What Goes Wrong
- Your sample doesn't represent the whole population
- Some groups are over-represented or under-represented
- You reach conclusions that only apply to your sample, not the broader population
- Results are misleading because your sample is skewed
Common Example
- Surveying only online users to understand all customer preferences
- Testing a new product only with your most loyal customers
- Analyzing stock performance during a bull market and calling it the norm
How to Avoid
- Ensure your sample is random and representative
- Check for under-represented groups
- Use stratified sampling when populations have distinct groups
- Document your sampling methodology clearly
Data Dredging
Repeatedly testing new hypotheses against the same data set, failing to acknowledge that most correlations will be results of chance.
What Goes Wrong
- You test hundreds of hypotheses on the same data
- Some "correlations" appear purely by chance
- You report the significant findings and ignore the failed tests
- Results don't replicate when tested on new data
Common Example
- Testing 100 stock indicators until you find one that predicts price movement (by chance)
- Looking for "significant" correlations in a dataset with thousands of variables
- Medical research testing dozens of treatments until finding one that appears effective
How to Avoid
- Form hypotheses BEFORE analyzing data
- Use separate train/test datasets
- Apply multiple testing corrections (Bonferroni, FDR)
- Validate findings on new data before drawing conclusions
Survivorship Bias
Drawing conclusions from an incomplete set of data because that data has survived some selection criteria, ignoring failures.
What Goes Wrong
- You only see the success stories, not the failures
- The data you're looking at is already filtered by success
- You overestimate success rates because failures are invisible
- Your conclusions don't account for what didn't make it into the data
Common Example
- Analyzing only Fortune 500 companies to understand business success (ignoring millions of failures)
- Looking at millionaires' strategies without considering all the people who followed the same advice but failed
- WWII aircraft analysis: armoring areas with bullet holes, ignoring planes that were shot down
How to Avoid
- Always ask: "What's missing from this dataset?"
- Include failure cases in your analysis
- Understand the selection criteria that created your data
- Compare survivors to non-survivors
False Causality
Falsely assuming that when two events appear related, one must have caused the other (correlation ≠ causation).
What Goes Wrong
- Two things move together, so you assume one caused the other
- You ignore confounding variables that explain both
- Temporal relationship (A before B) is mistaken for causation
- You miss that both might be caused by a third variable
Common Example
- Ice cream sales correlate with drowning deaths → ice cream causes drowning? (Both increase in summer)
- Company revenue increases after hiring a new CEO → the CEO caused the increase? (Market growth?)
- Website redesign launches, traffic increases → the redesign worked? (Seasonal trends?)
How to Avoid
- Always ask "Could there be a confounding variable?"
- Look for temporal precedence (cause before effect)
- Use randomized controlled experiments when possible
- Use statistical methods that account for confounders
Cherry Picking
Selecting results that fit your claim and excluding those that don't, presenting incomplete evidence as if it's comprehensive.
What Goes Wrong
- You report only the data that supports your narrative
- You hide or downplay contradictory findings
- You choose convenient time periods that fit your claim
- You present correlation from one group while ignoring other groups
Common Example
- Marketing uses only months when sales rose, ignoring months of decline
- Politician shows unemployment stats from best-performing regions only
- Fund manager advertises returns from best-performing years, hides the bad years
How to Avoid
- Present all relevant data, not just supporting data
- Show the full time period, not just convenient windows
- Disclose your data selection criteria upfront
- Ask yourself: "What would someone with the opposite view find?"
Real-World Case Studies
How these fallacies have led to actual problems
Prevention & Best Practices
How to protect against these five fallacies
The Meta-Lesson: Be skeptical::of your own analysis most of all. Assume you're wrong until proven otherwise. Ask critical questions. Seek out contradictory evidence. The most dangerous fallacy is thinking you're immune to these biases.
Five Principles of Sound Analysis
Core tenets for avoiding data fallacies
A Final Thought
Data is powerful. But power without wisdom is dangerous. These five fallacies are the most common ways smart people arrive at wrong conclusions. By understanding them, you don't just improve your own analysis::you become better at spotting misleading claims from others.
The goal isn't to paralyze yourself with doubt. It's to approach data with the right combination of confidence and caution: confident in your ability to learn from data, but cautious about jumping to conclusions.